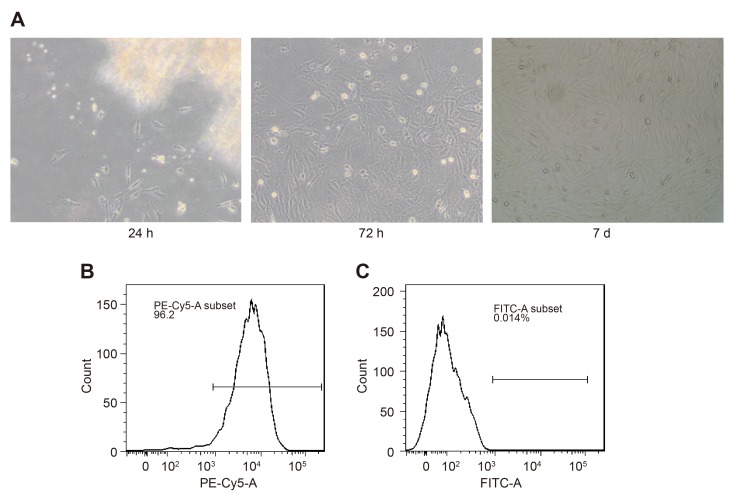
Figure 1.
Culture and identification of MenSCs. (A) Morphological observation of MenSCs at different time points: Left panel, cell morphology at the 24 h time interval (magnification, ×100); middle panel, cell morphology at the 72 h time interval (magnification, ×100); right panel, cell morphology at the 7 day time interval (magnification, ×100). (B and C) MenSCs examined by flow cytometry exhibited (B) high CD90-PE expression and (C) low CD146-FITC expression. CD, cluster of differentiation; FITC, fluorescein isothiocyanate; MenSCs, menstrual blood-derived stem cells; PE, phycoerythrin.

