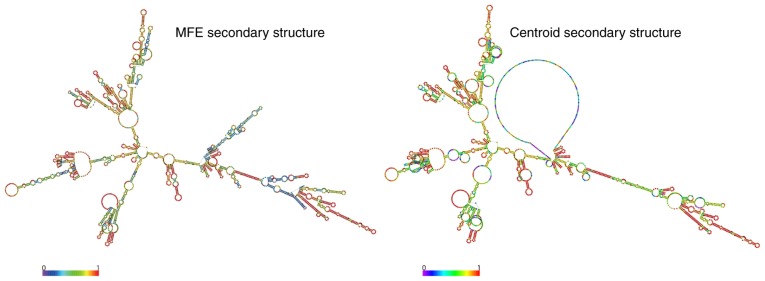
Figure 1.
Coding potential analyses of CCAT1 transcripts. The CCAT1 prediction structure, according to MFE and partition function. The colour scale indicates the confidence of the prediction for each base, with shades of red indicating strong confidence (rna.tbi.univie.ac.at/). CCAT1, colon cancer-associated transcript 1; MFE, minimum free energy.

