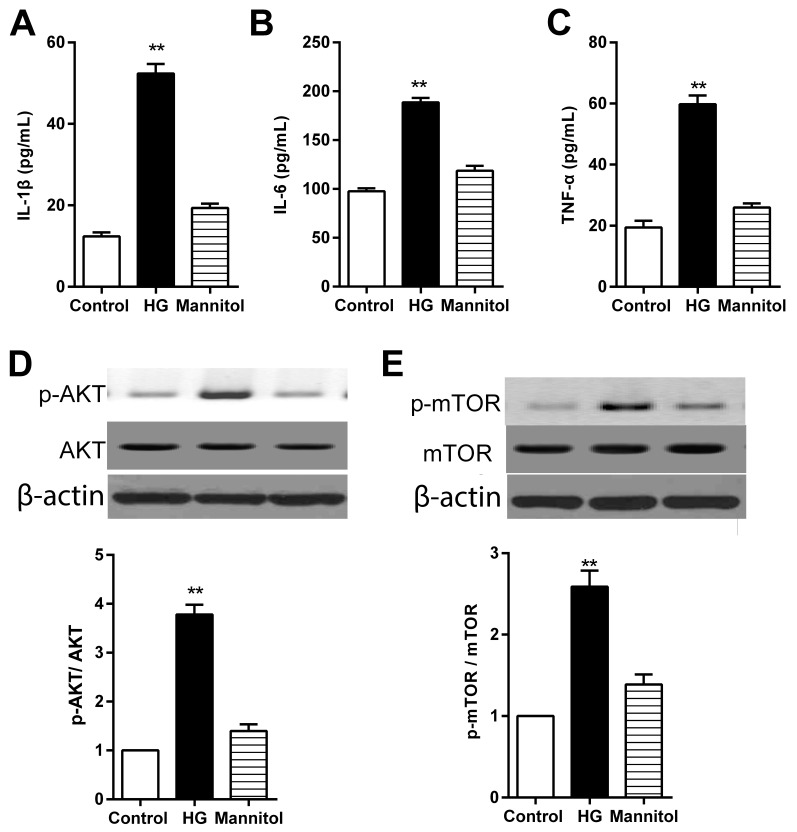
Figure 3.
High glucose treatment increases the secretion levels of IL-1β, IL-6 and TNF-α in RPECs. (A-C) Expression levels of (A) IL-1β, (B) IL-6 and (C) TNF-α in the culture medium of cells treated with either 30 mmol/l glucose or 24.4 mmol/l mannitol for 12 h were measured by ELISA. (D and E) Expression levels of p-AKT, total AKT, p-mTOR and total mTOR in cells treated with either 30 mmol/l glucose or 24.4 mmol/l mannitol for 12 h as measured by western blot analysis. Data are presented as the mean ± standard error of the mean; n=3; **P<0.01 vs. control. CUR, curcumin; HG, high glucose; IL, interleukin; mTOR, mammalian target of rapamycin; p, phosphorylated; PI3K, phosphoinositide 3-kinase; RPEC, retinal pigment epithelial cell; TNF, tumor necrosis factor.

