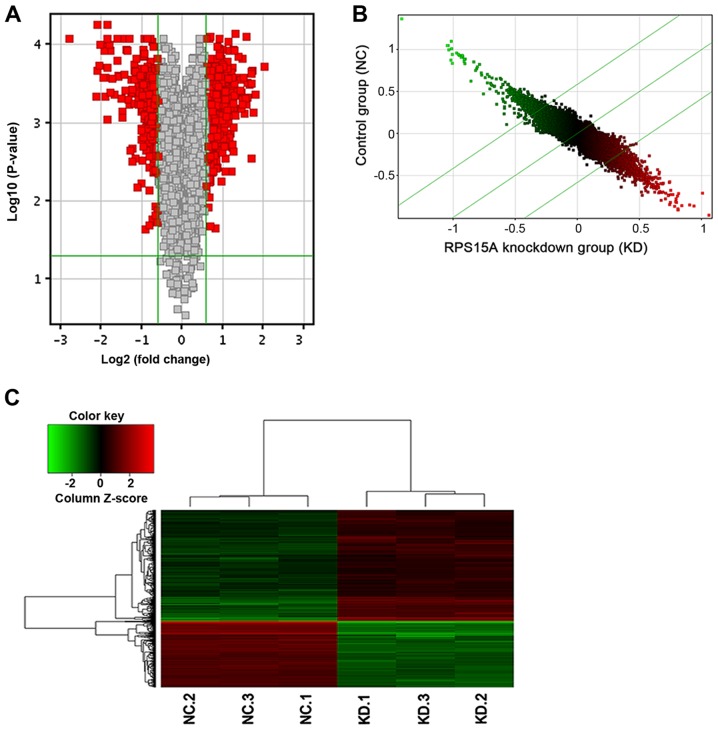
Figure 5.
(A) Volcano plot. The red point in the plot represents the differentially expressed mRNAs with statistical significance. (B) Scatter plot. The plot located in median (Y=X) represents a Fold Change value=1. X axial: KD group; Y axial: NC group. (C) Cluster map; red indicates upregulated and green indicates downregulated. The top cluster tree was generated according to the value of each sample; the left cluster tree was generated according to the value of each gene. RPS15A, ribosomal protein S15A. NC, negative control; KD, knockdown.

