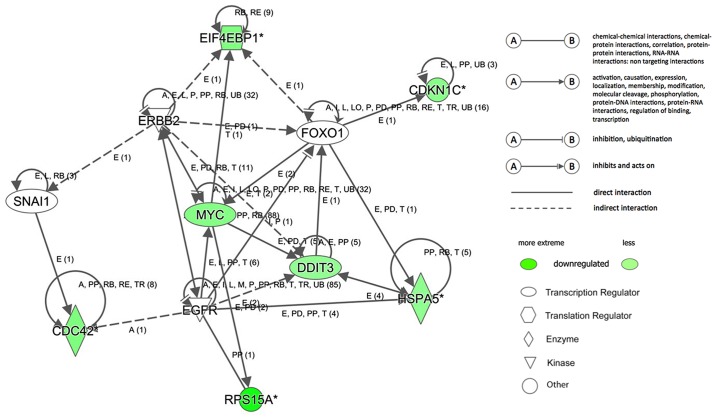
Figure 7.
Networks and RPS15A downstream genes. Regulator effects analysis and interaction networks of genes. The predicted downregulated molecules are marked in green. CDKN1C, cyclin dependent kinase inhibitor 1C; DDIT3, DNA damage inducible transcript 3; EGFR, epidermal growth factor receptor 1; EIF4EBP1, eukaryotic translation initiation factor 4E binding protein 1; ERBB2, erb-b2 receptor tyrosine kinase 2; FOXO1, forkhead box O1; HSPA5, heat shock protein family A (Hsp70) member 5; MYC, MYC proto-oncogene, bHLH transcription factor; RPS15A, ribosomal protein S15A; SNAI1, snail family transcriptional repressor 1.

