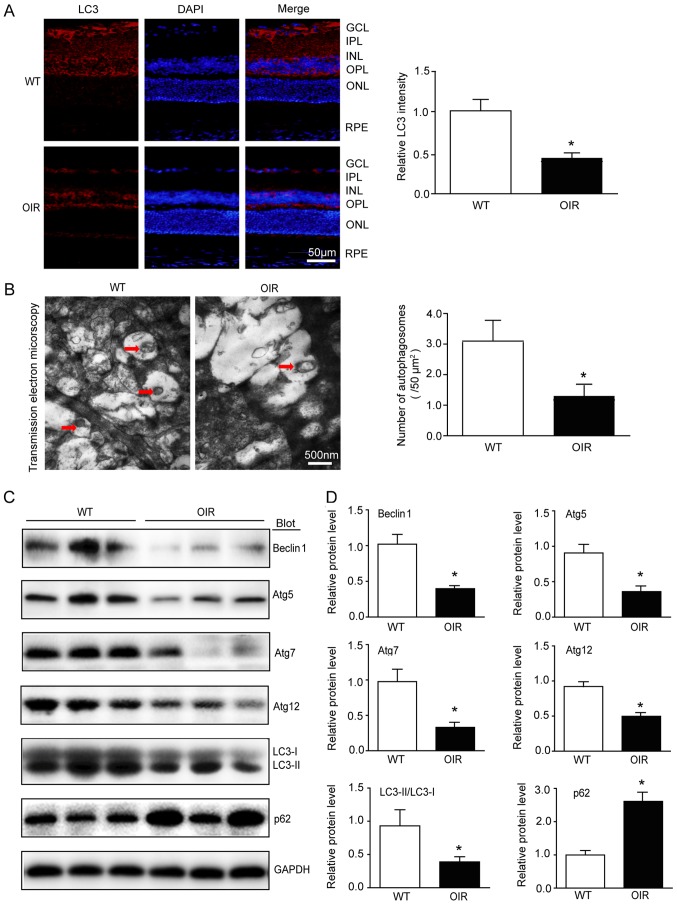
Figure 5.
Autophagic flux is reduced in the retinas of OIR mice. (A) Immunostaining of the LC3 (red) in the retinal sections (left) and quantification of fluorescence intensity (right; n=6 mice per group). Nuclei were counterstained with DAPI (blue). Scale bar, 50 µm. (B) Transmission electron micrographs and quantification of the autophagosomes in retinas. Scale bar, 500 nm. (C) Immunoblot analysis of the protein expression levels of Beclin1, Atg5, Atg7, Atg12, LC3 and p62 in the retinas. (D) Quantification of the protein bands (n=6 mice per group). GAPDH as an internal control. Data are the mean ± standard deviation of the mean. *P<0.05 vs. WT mice. OIR, oxygen-induced retinopathy; GCL, ganglion cell layer; IPL, inner plexiform layer; INL, inner nuclear layer; OPL, outer plexiform layer; ONL, outer nuclear layer; RPE, retinal pigment epithelium; Atg, autophagy protein; LC3, microtubule associated protein 1 light chain 3α; WT, wild-type.

