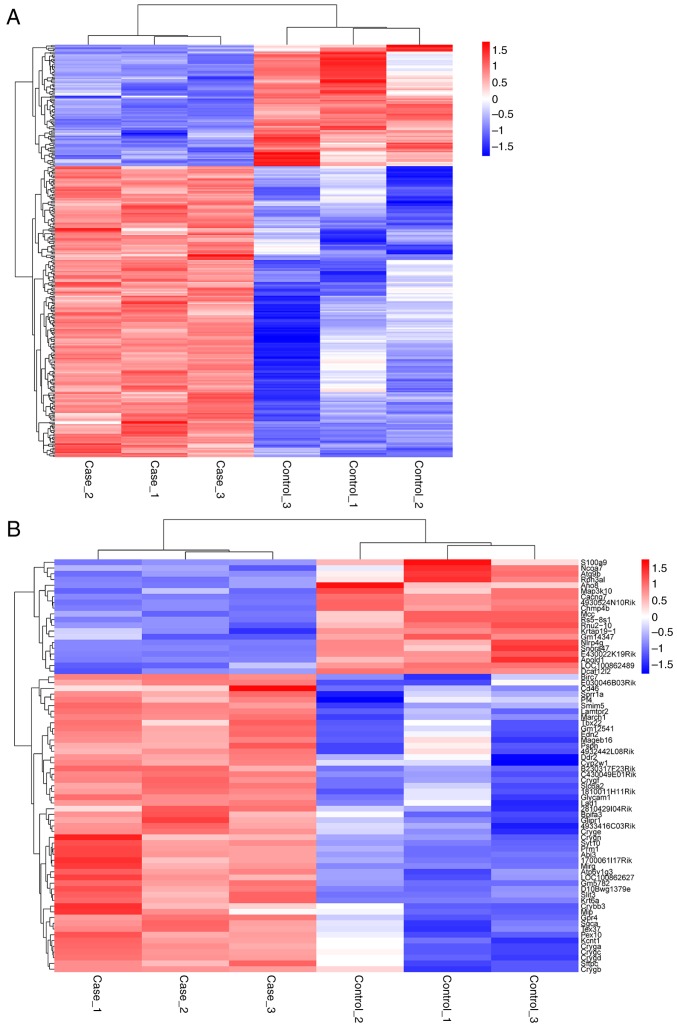
Figure 2.
(A) Heat map of the differentially expressed lncRNAs for the DR group and control group. (B) Heat map of differentially expressed mRNAs for the DR group and control group. All the values were normalized to t values. In diabetic retina samples, 89 lncRNAs and 14 miRNAs were upregulated, whereas 214 lncRNAs and 3 miRNAs were downregulated. lncRNAs, long non-coding RNAs; DR, diabetic retinopathy; mRNAs, messenger RNAs; miRNAs, microRNAs.

