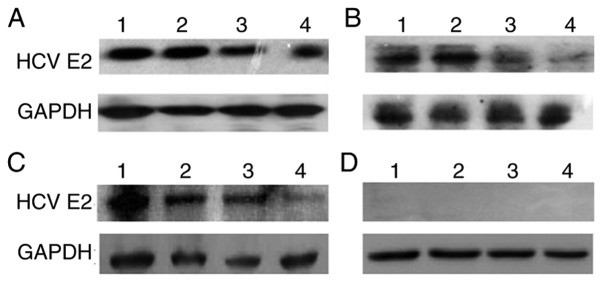
Figure 2.
Comparison of HCV E2 expression across vaccine groups in mouse skeletal muscle. Western blot analysis of injection-area skeletal muscle from 2 mice/group 12 weeks (lanes 1 and 2) and 16 weeks (lanes 3 and 4) after immunization. (A) rAAV2/rh32.33.HCV E2; (B) rAAV2/8. HCV E2; (C) pAAV.CMV.HCV.E2; (D) non-immunized control. The protein GAPDH (36 kDa) was used as an internal control. The result shown is a representative of three experiments.

