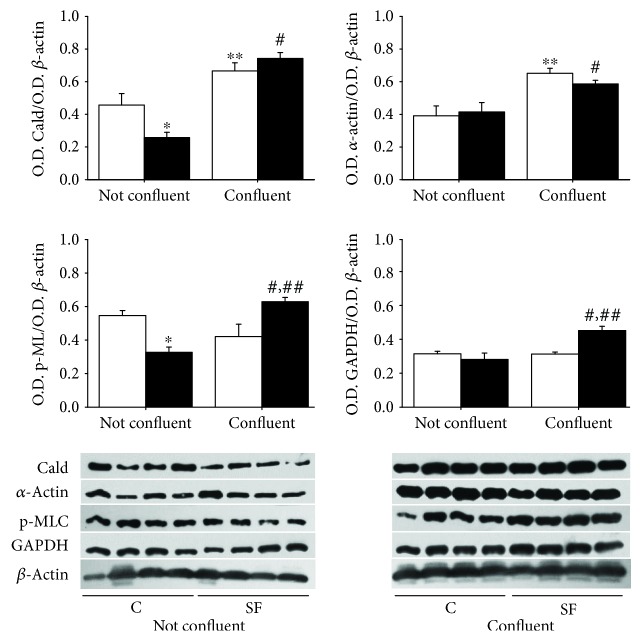
Figure 7.
Content analysis of caldesmon (Cald: 70 kDa), α-actin (37 kDa), phosphorylated myosin light chain (p-MLC: 50 kDa), and GAPDH (37 kDa) quotient in SMCs (C, open bars; SF, black bars) during nonconfluent growth state (72 h) and confluent state (120 h). The values in the graph correspond to the ratio of O.D. Cald/O.D. β-actin, O.D. α-actin/O.D. β-actin, O.D. p-MLC/O.D. β-actin, and O.D. GAPDH/O.D. β-actin ± SE (n = 4 different animals). ∗p < 0.05 C not confluent vs. SF not confluent, ∗∗p < 0.05 C not confluent vs. C confluent, #p < 0.05 SF not confluent vs. SF confluent, and ##p < 0.05 C confluent vs. SF confluent.

