Figure 4.
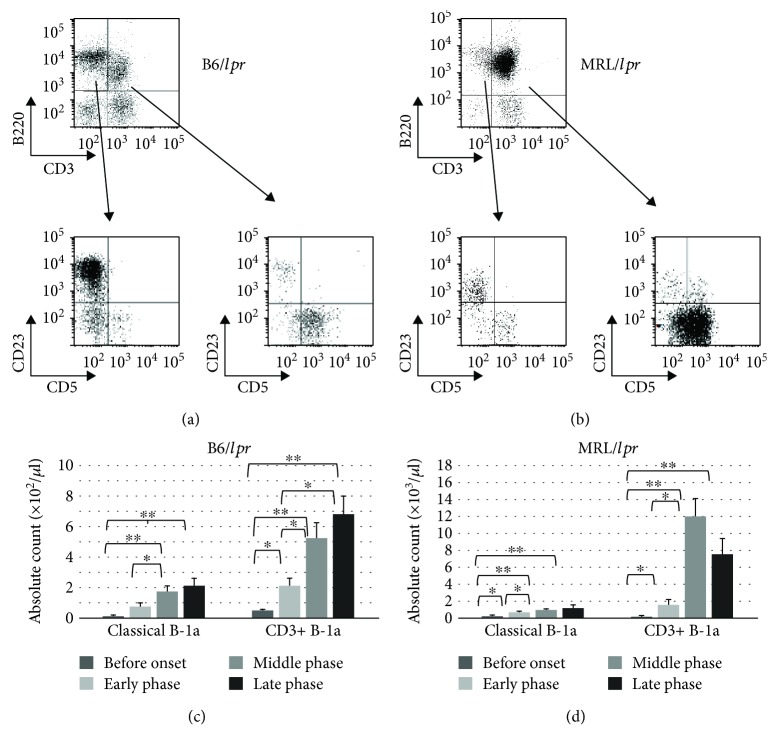
Detection of B-1a cells in the CD3+CD4-CD8-B220+ population. Peripheral blood cells obtained from the B6/lpr mice (n = 18) were stained with CD3, B220, and CD5 antibodies and analyzed using flow cytometry. Representative flow cytometry plots (a) and absolute count of classical B-1a cells and CD3+ B-1a cells (c) are shown. Peripheral blood cells obtained from the MRL/lpr mice (n = 21) were stained with CD3, B220, and CD5 antibodies and analyzed using flow cytometry. Representative flow cytometry plots (b) and absolute count of classical B-1a cells and CD3+ B-1a cells (d) are shown.

