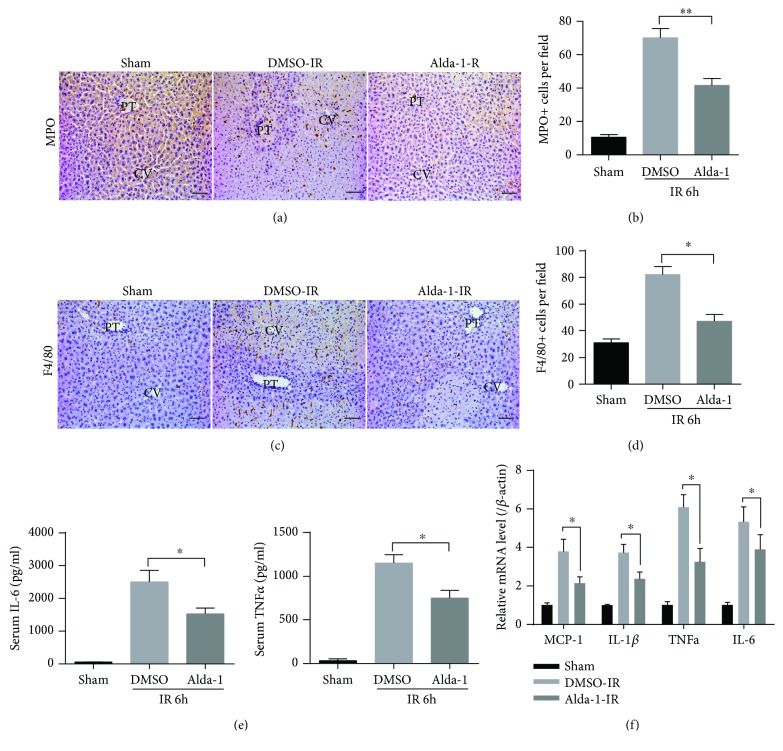
Figure 3.
Alda-1 pretreatment restrains inflammatory responses in livers during IR injury. (a, b) Representative sections of MPO staining and the numbers of MPO-positive cells in liver sections at 6 h after reperfusion or sham operation. PT: portal triads; CV: central veins. Scale bars: 50 μm. (c, d) Representative sections of F4/80 staining and the numbers of F4/80-positive cells in liver sections at 6 h after reperfusion or sham operation. PT: portal triads; CV: central veins. Scale bars: 50 μm. (e) Serum IL-6 and TNF-α levels at 6 h after reperfusion or sham operation were measured by ELISA. (f) The mRNA levels of cytokines and chemokines at 6 h after reperfusion or sham operation were determined by quantitative RT-PCR. All data are shown as mean ± SEM (n = 4–6). ∗∗ P < 0.01, ∗ P < 0.05.

