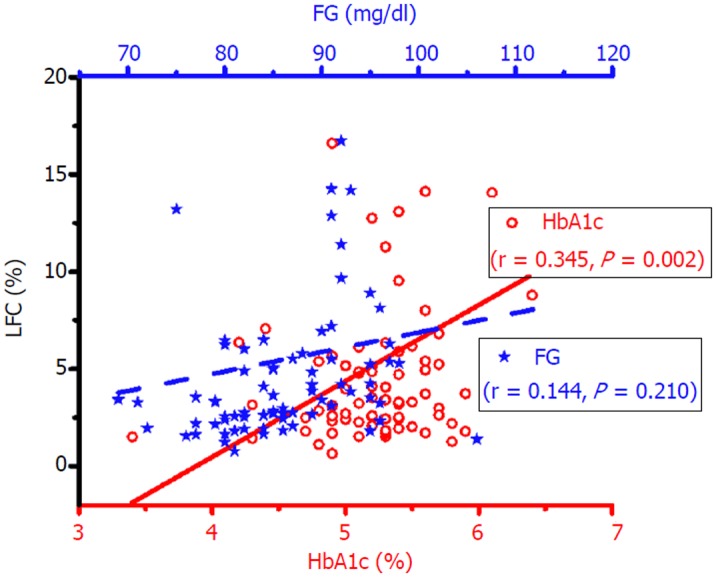
Figure 3.

Pearson correlation between glycosylated hemoglobin (circle in red, lower x axis), fasting plasma glucose (star in blue, upper X axis), and liver fat content as measured by proton magnetic resonance spectroscopy. BMI: Body mass index; FG: Fasting plasma glucose; HbA1c: Glycosylated hemoglobin; LFC: Liver fat content.
