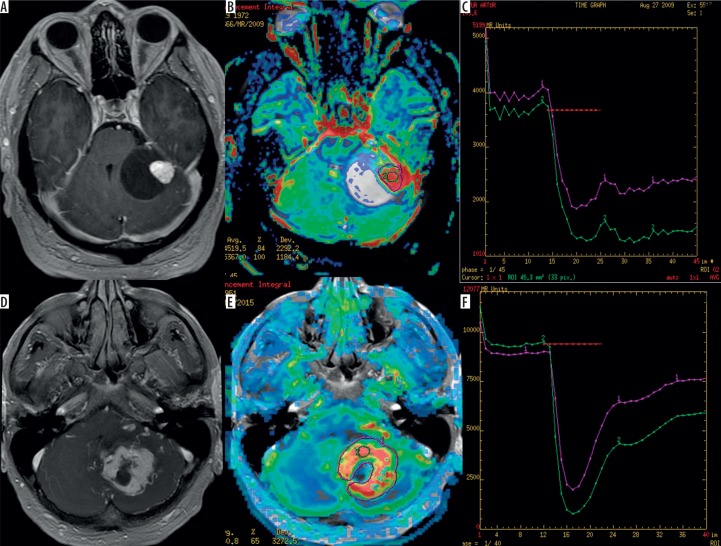
Figure 2.
Two examples of haemangioblastomas in the cerebellum presenting as a cystic tumour with a mural nodule (A) and as a more solid tumour (D) on post-contrast T1-weighted images. CBV maps (B and E) show high perfusion values indicated by red colour while perfusion curves (C and F) present only partial return to the baseline level (red lines)

