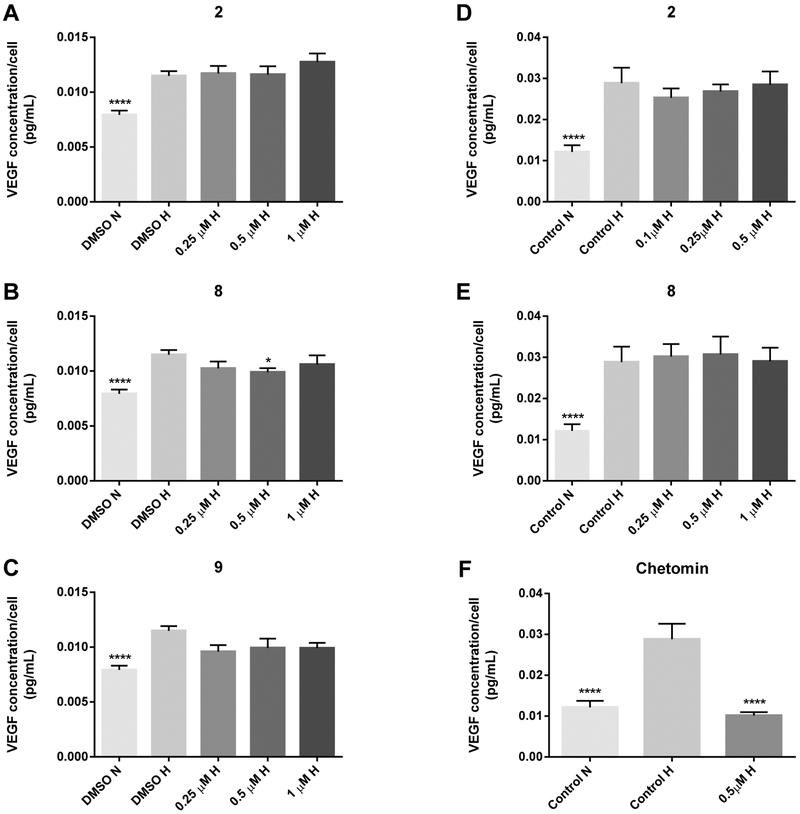
Figure 3.
VEGF ELISA results of compounds 2, 8, 9, and chetomin in LNCaP (A−C) and HCT 116 cells (D−F) after 18 h (LNCaP) or 48 h (HCT 116) treatment under hypoxic conditions (0.5−1% O2). Results are expressed as VEGF concentration per cell (pg/mL) and are expressed as the average of triplicate (LNCaP) or quadruplicate (HCT 116) experiments ± SEM (n = 3). Data were analyzed using either the exact Wilcoxon rank sum test (LNCaP) or the stratified Wilcoxon rank sum test (HCT 116) with Hochberg’s method for adjusting p values for multiple comparisons (reference group: control H). *p ≤ 0.05, **p ≤ 0.01, ***p ≤ 0.001, ****p ≤ 0.0001. N = normoxia; H = hypoxia.

