
Figure 1.
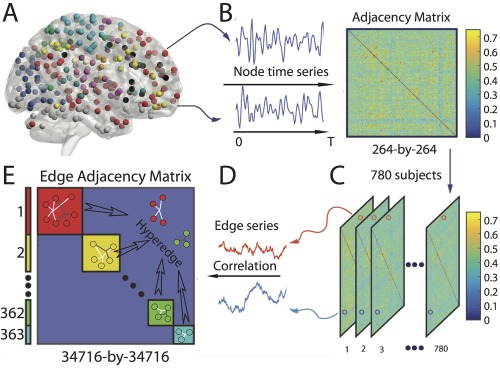
Schematic of hypergraph construction. (A) We first extract time series for each region of interest. (B) Next, we calculate the functional connectivity between pairs of regions using a wavelet‐based coherence, yielding an adjacency matrix. We perform the steps outlined in panels (A) and (B) for each of the 780 youth in the Philadelphia Neurodevelopmental Cohort and (C) stacked the adjacency matrices across subjects. (D) We extract the vector of weights for each edge over subjects. (E) Finally, we generate an edge‐by‐edge adjacency matrix (or hypergraph) [Bassett et al., 2014] by computing the Pearson correlation coefficient between pairs of edge weight time series. A hyperedge is then defined as a cluster of edges that co‐vary with one another; we can identify these clusters by applying community detection techniques to the hypergraph. [Color figure can be viewed at http://wileyonlinelibrary.com]