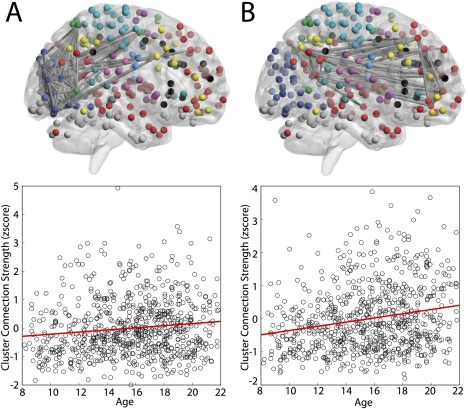
Figure 6.

Cluster hyperedges track developmentally driven covariation of functional connections. Two clusters displayed age‐related increased in average strength, as tested by a linear model with age and movement. Panel (A) displays the relationship between edge strength and age in cluster 2, composed predominantly of regions in the visual system: . Panel (B) displays the relationship between edge strength and age in cluster 5, composed predominantly of regions in the default mode: . [Color figure can be viewed at http://wileyonlinelibrary.com]
