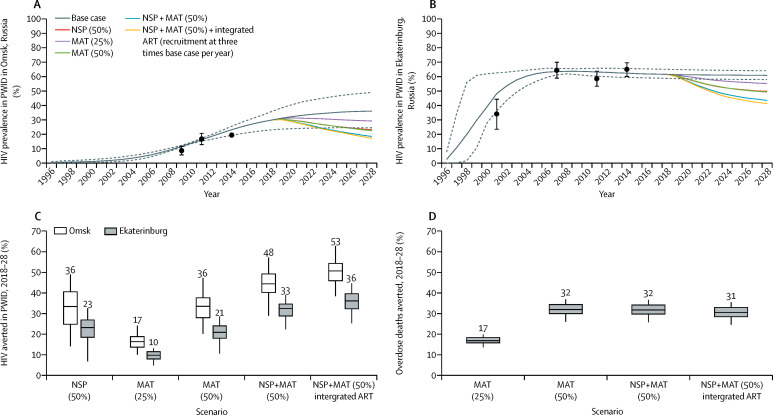
Figure 19.
Model projections of the effect of integrated harm reduction and HIV services in two Russian cities
Model projections of (A) median HIV prevalence in PWID in Omsk, Russia, (B) median HIV prevalence in PWID in Ekaterinburg, Russia, (C) proportion HIV infections averted in PWID in 2018–28, and (D) proportion of fatal overdoses averted in PWID in 2018–28 with various levels of intervention scale-up. Scenarios include no harm reduction or ART (base case), expansion of NSPs to 50% coverage in PWID (NSP 50%), expansion of MAT to 25% or 50% of PWID (MAT 25%; MAT 50%), combination MAT and NSP to 50% of PWID (MAT+NSP 50%), or combination MAT and NSP to 50% of PWID integrated with ART recruited at three times the base-case recruitment rate of HIV-infected PWID on harm reduction per year from 2018. Observed HIV prevalence data in PWID shown as black circles and 95% CI; dashed lines are 2·5–97% uncertainty bounds. Box plots indicate the median (middle line) projections, 25–75% percentile range (boxes), and 2·5–97·5% percentile range (whiskers), and median estimates reported above box plots. PWID=people who inject drugs. ART=antiretroviral therapy. MAT=medication-assisted therapy. NSP=needle and syringe programme.

