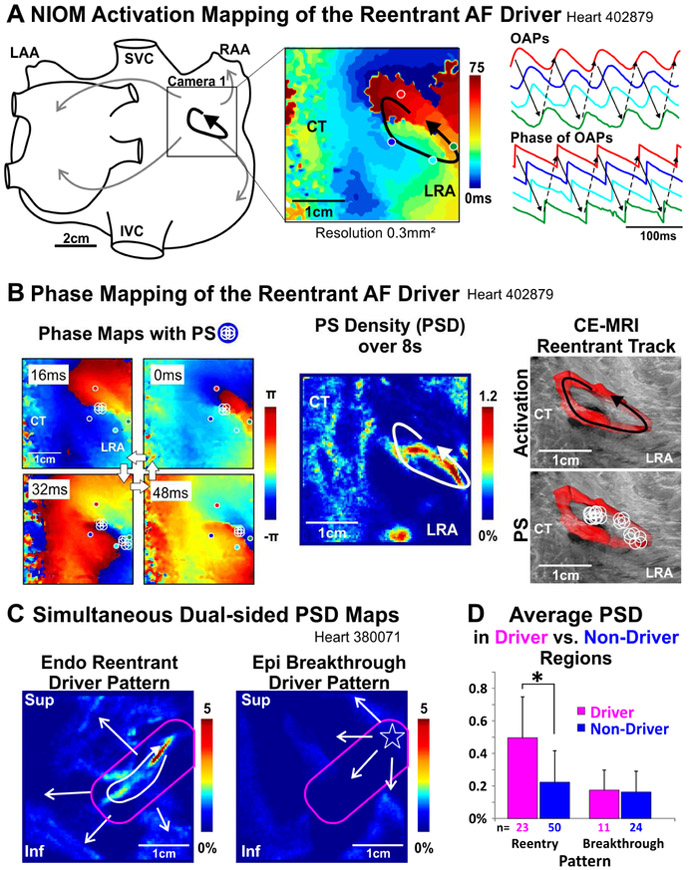
Figure 1. AF Driver Identification by NIOM Activation and Phase Mapping.
A. NIOM activation map, optical action potentials (OAPs), and their phase of a reentrant AF driver. B. Left to Right, snapshots of instantaneous phase maps with phase singularities (PS) shown by white circles; Phase singularity density (PSD) map; 3D contrast-enhanced MRI (CE-MRI) reconstruction of the reentrant track in red with overlaid reentrant activity and PSs. C. Simultaneous dual-sided PSD maps of reentrant and breakthrough patterns. Driver regions outlined in pink. D. Average PSD in driver vs non-driver regions. *P<0.05. AF-atrial fibrillation; CT-crista terminalis; Endo-endocardium; Epi-epicardium; NIOM-near infrared optical mapping; Inf/Sup-inferior/superior lateral right atrium (LRA); IVC/SVC-inferior/superior vena cava; LAA/RAA-left/right atrial appendage.

