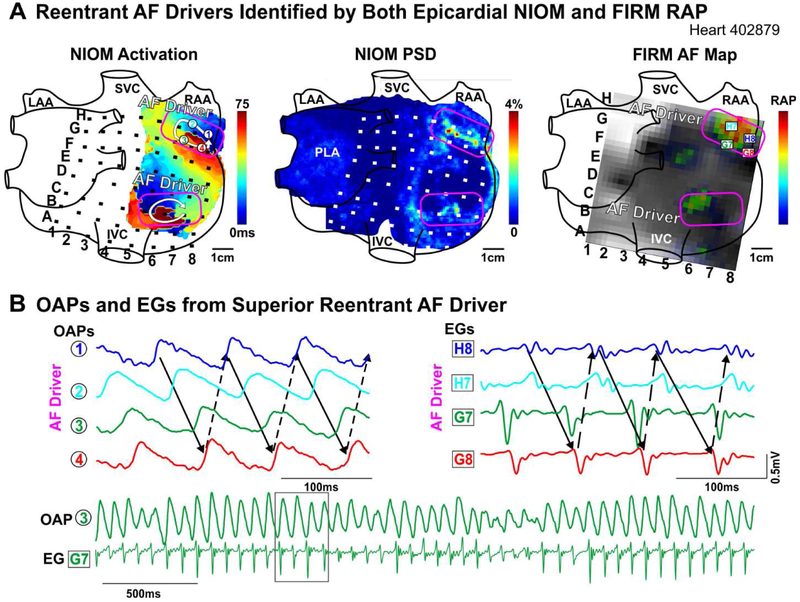
Figure 3. Reentrant AF Drivers Visualized by NIOM and FIRM.
A. Left to Right: Epicardial NIOM activation map; NIOM PSD map; and snapshot of epicardial FIRM movie with rotational activity profiles (RAP). NIOM-defined drivers outlined in pink. B. OAPs and unipolar FIRM EGs, black box shows time window for OAPs and EGs above. Abbreviations as in Figure 2.

