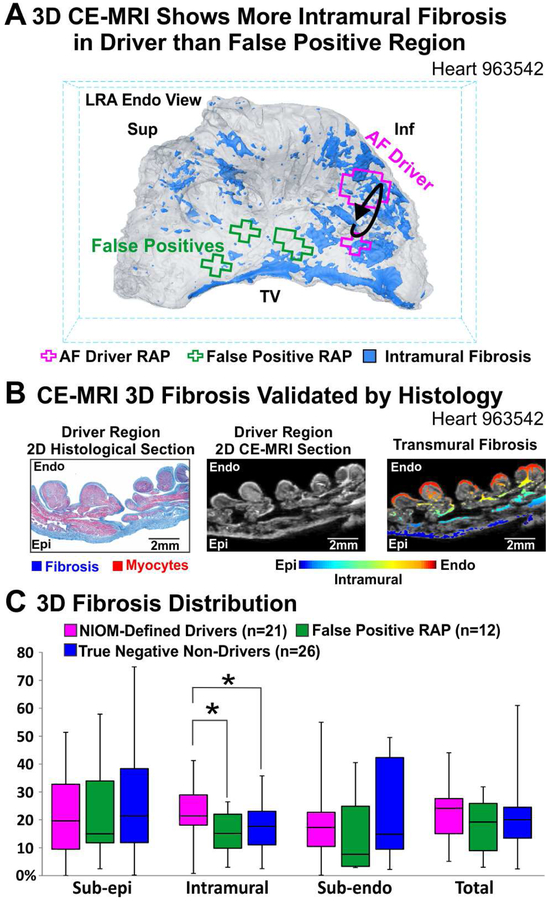
Figure 6. 3D Distribution of Fibrosis in AF Driver vs False Positive Regions.
A. 3D CE-MRI of LRA showing that higher intramural fibrosis (blue) underlies AF driver RAP regions (pink) than false positive RAP regions (green). B. 2D transmural sections from the driver region (Left to Right) with Masson’s Trichrome staining, show fibrosis in blue; CE-MRI fibrosis in white; CE-MRI with fibrosis color-coded for transmural location. C. Percent of fibrotic tissue by transmural location. *P<0.05. Abbreviations as in Figure 4; TV-tricuspid valve.

