
Figure 1. 33D1+ and XCR1+ DC Subsets Survey Different Regions of the Spleen.
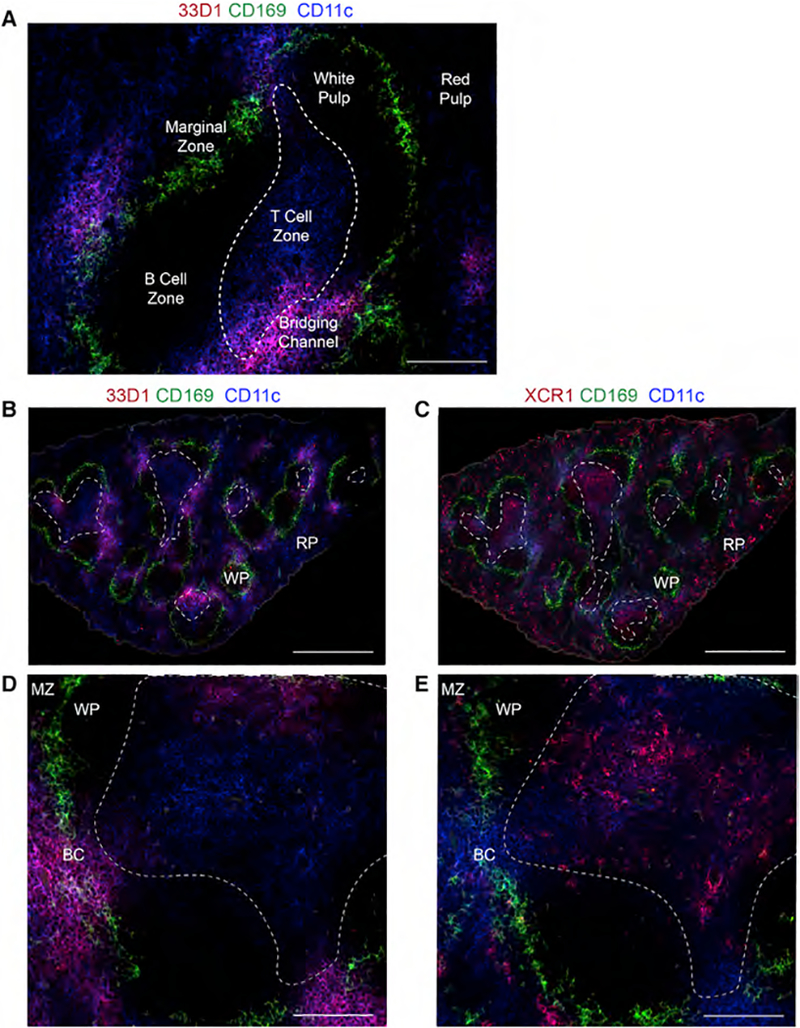
(A) Fluorescence image of a spleen from a naive wild-type mouse highlighting splenic architecture. Red indicates 33D1, green indicates CD169, and blue indicates CD11c antibodies. Scale bar, 100 μm. Dotted line demarcates the T cell zone (TCRβ).
(B–E) Fluorescence images of serial sections from one spleen from a naive wild-type mouse demonstrating distinct DC subset regions. Dotted lines demarcate the T cell zone (see Figures S1B and S1C). (B) Red indicates 33D1, green indicates CD169, and blue indicates CD11c. Scale bar, 500 μm. (C) Red indicates XCR1, green indicates CD169, and blue indicates CD11c. Scale bar, 500 μm. (D) Red indicates 33D1, green indicates CD169, and blue indicates CD11c. Scale bar, 100 μm. (E) Red indicates XCR1, green indicates CD169, and blue indicates CD11c. Scale bar, 100 μm. A representative spleen from 18 different WT mice. RP, red pulp; WP, white pulp; BC, bridging channels; MZ, marginal zone.
See also Figures S1B and S1C.