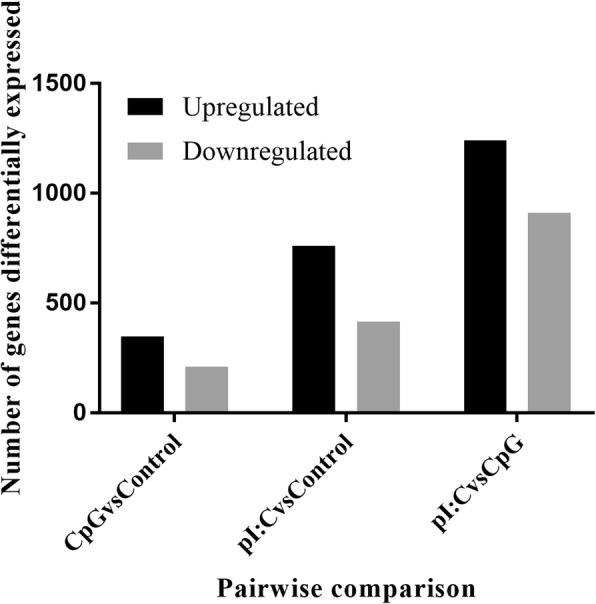
Fig. 3.

Pairwise comparison of differentially expressed genes in Bomac cells stimulated with CpG DNA or poly(I:C). The compared treatment groups are CpG DNA vs control, poly(I:C) vs control, and poly(I:C) vs CpG DNA

Pairwise comparison of differentially expressed genes in Bomac cells stimulated with CpG DNA or poly(I:C). The compared treatment groups are CpG DNA vs control, poly(I:C) vs control, and poly(I:C) vs CpG DNA