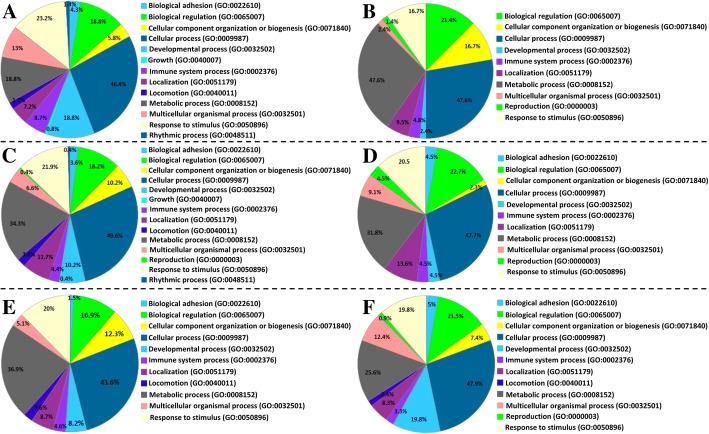
Fig. 5.
Gene ontology plotted by PANTHER (http://www.pantherdb.org/) showing biological processes for (a) CpG DNA vs Control upregulated genes; b CpG DNA vs Control downregulated genes; c poly(I:C) vs Control Upregulated genes; d poly(I:C) vs Control downregulated genes; e poly(I:C) vs CpG DNA upregulated genes; f poly(I:C) vs CpG DNA downregulated genes

