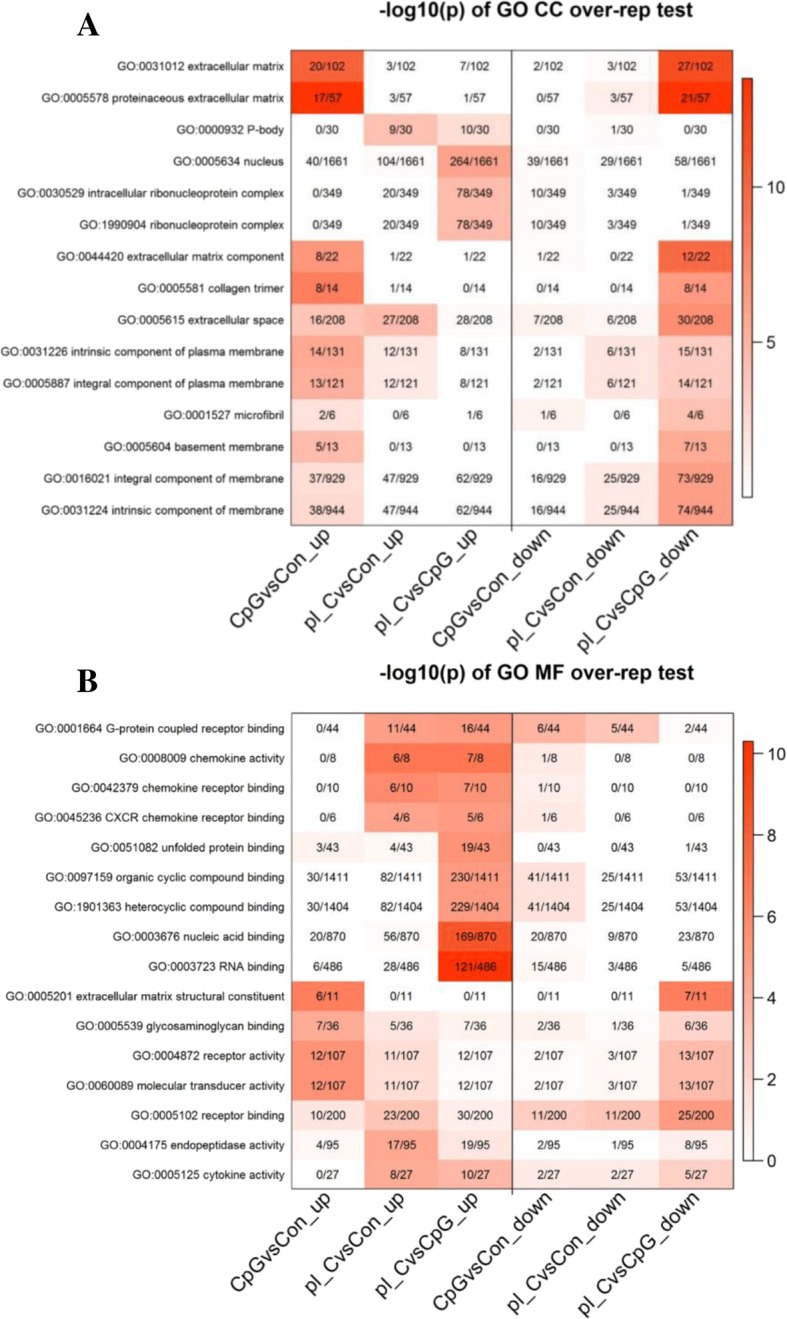
Fig. 6.

Charts presenting the Gene Ontology (GO) based classification of differentially expressed genes in Bomac cell line stimulated with CpG DNA or poly(I:C) to cellular components and molecular function processes. a Cellular Components (CC), b Molecular functions (MF). CpG DNAvsCon_up = upregulated genes in the CpG DNA vs control comparison; pI_CvsCon_up = upregulated genes in the poly(I:C) vs control comparison; pI_CvsCpG DNA_up = upregulated genes in the poly(I:C) vs CpG DNA comparison; CpG DNAvsCon_down = downregulated genes in the CpG DNA vs control comparison; pI_CvsCon_down = downregulated genes in the poly(I:C) vs control comparison; pI_CvsCpG DNA_down = downregulated genes in the poly(I:C) vs CpG DNA comparison
