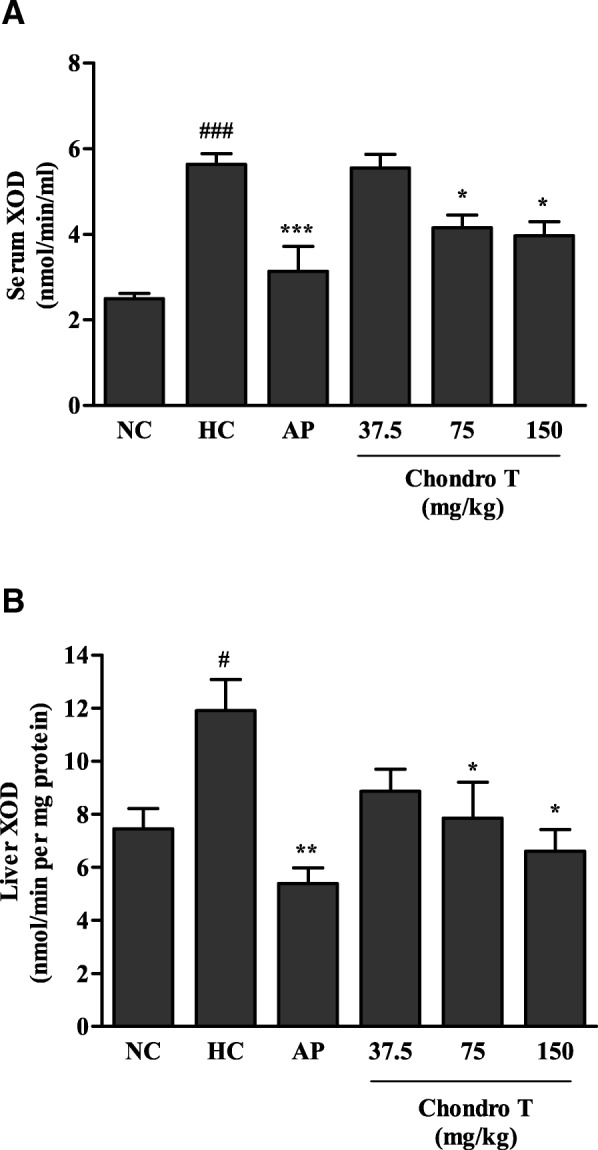
Fig. 2.

Effects of ChondroT on (a) serum and (b) liver xanthine oxidase (XOD) activities of potassium oxonate (PO)-induced hyperuricemic mice NC, normal control; HC, hyperuricemic control with potassium oxonate (300 mg/kg); AP, allopurinol (5 mg/kg). Values are expressed as the mean ± standard error (S.E., n = 5). #P < 0.05 and ###P < 0.001 compared with NC group; *P < 0.05, **P < 0.01, and ***P < 0.001 compared with HC group
