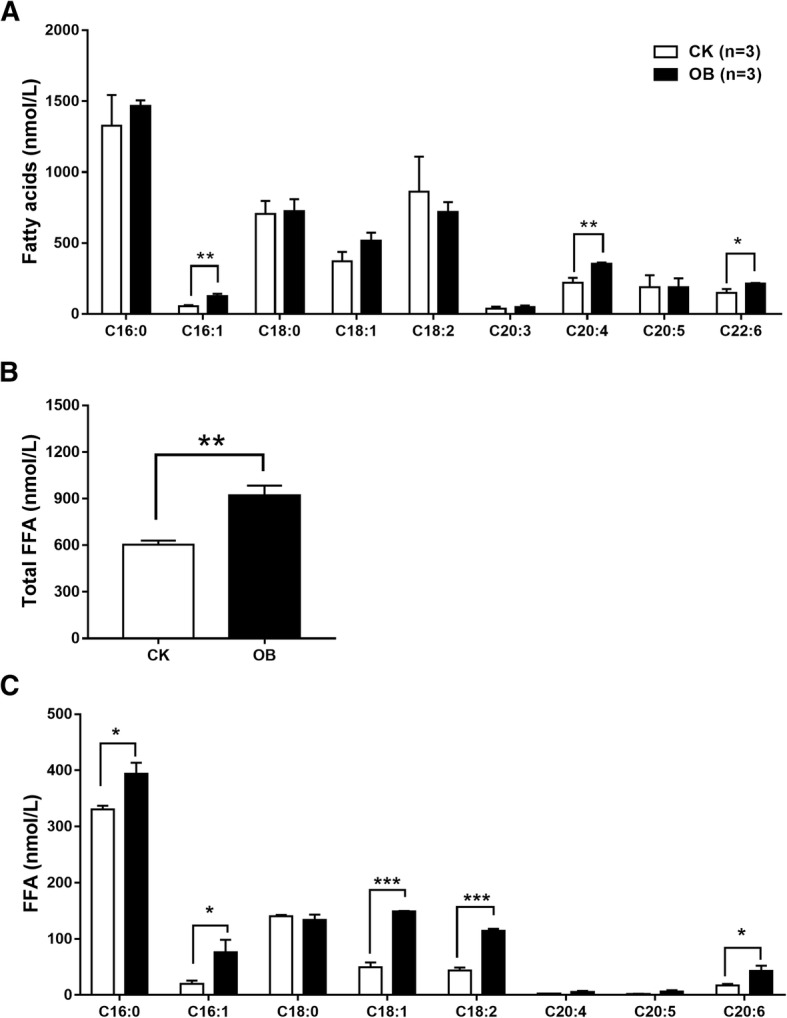
Fig. 1.

Levels of plasma fatty acid compositions and free fatty acids in obese monkeys (OB, n = 3) and normal monkeys (CK, n = 3). Levels of fatty acid composition (a), total free fatty acids (b), and free fatty acids (FFAs) (c). Data are presented as mean ± standard error of the mean (SEM). Significant difference between CK and OB monkeys: *P<0.05, **P<0.01
