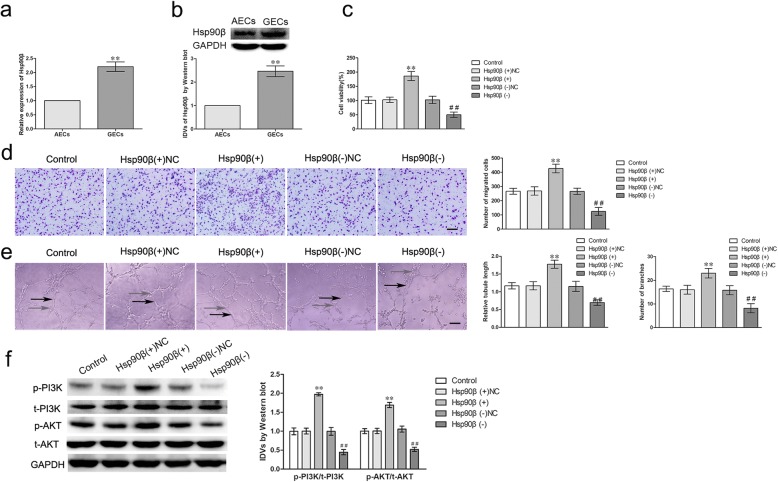
Fig. 7.
The expressions of Hsp90β in GECs and Hsp90β regulated the viability, migration and tube formation of GECs via PI3K/AKT pathway. a-b The mRNA and protein expressions of Hsp90β in AECs and GECs were evaluated by qRT-PCR and western blot. Data represent means ± SD (n = 5, each group). **P < 0.01 vs. AECs group. c The effect of Hsp90β knockdown on the viability of GECs were detected by CCK-8 assay. Values are means ± SD (n = 5, each group). **P < 0.01 vs. Hsp90β (+) NC group; ##P < 0.01 vs. Hsp90β (−) NC group. d The effect of Hsp90β knockdown on the migration of GECs were determined by Transwell assay. Values are means ± SD (n = 5, each group). **P < 0.01 vs. Hsp90β (+) NC group; ##P < 0.01 vs. Hsp90β (−) NC group. Scale bar represents 30 μm. e The effect of Hsp90β knockdown on the tube formation of GECs were evaluated by Matrigel tube formation assay. Values are means ± SD (n = 5, each group). **P < 0.01 vs. Hsp90β (+) NC group; ##P < 0.01 vs. Hsp90β (−) NC group. Scale bar represents 30 μm. f The protein expressions of PI3K/AKT in GECs were determined by western blot. Values represent the means ± SD (n = 5, each group). **P < 0.01 vs. Hsp90β (+) NC group; ##P < 0.01 vs. Hsp90β (−) NC group

