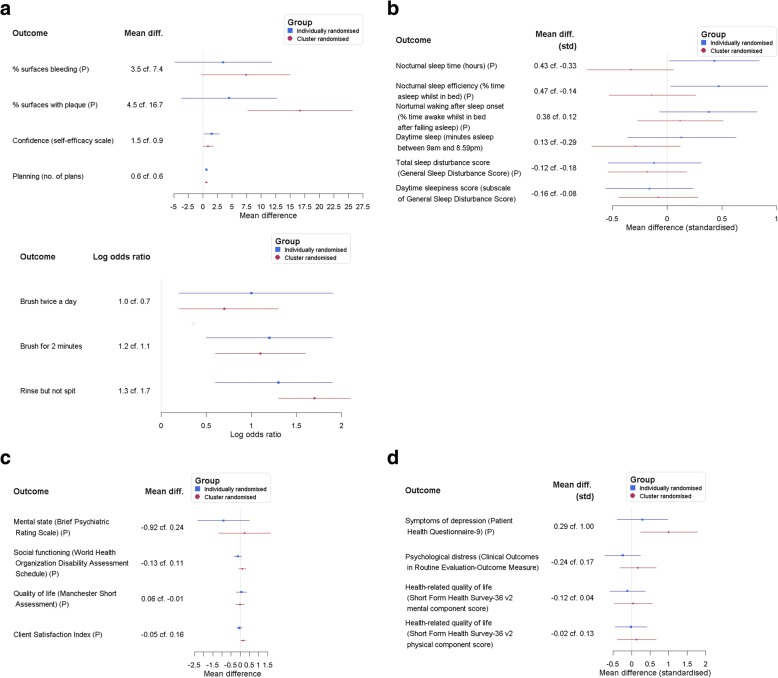
Fig. 2.
Forest plots for four trials that used both individual- and cluster-level randomisation; (P) = primary outcome. a) Clarkson et al. (2009) [36]. Choice of primary outcomes is based on sample size calculation; estimates are adjusted for baseline measures. Larger (more positive) treatment effects indicate benefit. b) Lee & Gay (2011) [37]. Estimates were standardised and calculated from summaries of means and SDs (mothers’ scores only). Larger (more positive) treatment effects indicate benefit. c) Marshall et al. (2004) [38]. Estimates used same adjustments as in the trial publication. Larger (more positive) treatment effects indicate benefit. d) Richards et al. (2008) [39]. Estimates were standardised and calculated from summaries of means and SDs. Larger (more positive) treatment effects indicate benefit

