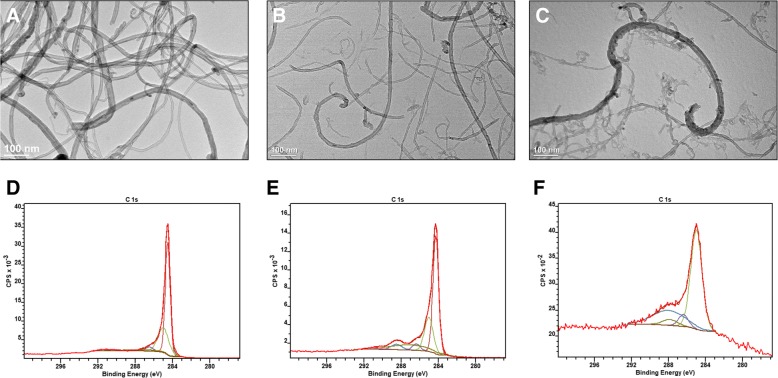
Fig. 1.
Pristine and carboxylated MWCNT TEM images and representative XPS plots. The 1 mg/mL suspensions of each nanoparticle were dried onto TEM grids for 30 s, and representative TEM images display the general structure of the pristine MWCNT (a), MWCNT Low-COOH (Lot #2) (b) and MWCNT High-COOH (Lot #1) (c). Representative XPS plots of the carbon 1 s regions for both the pristine MWCNT (d), MWCNT Low-COOH (e) and MWCNT High-COOH (f) display the relative increase in oxidized carbon bonds

