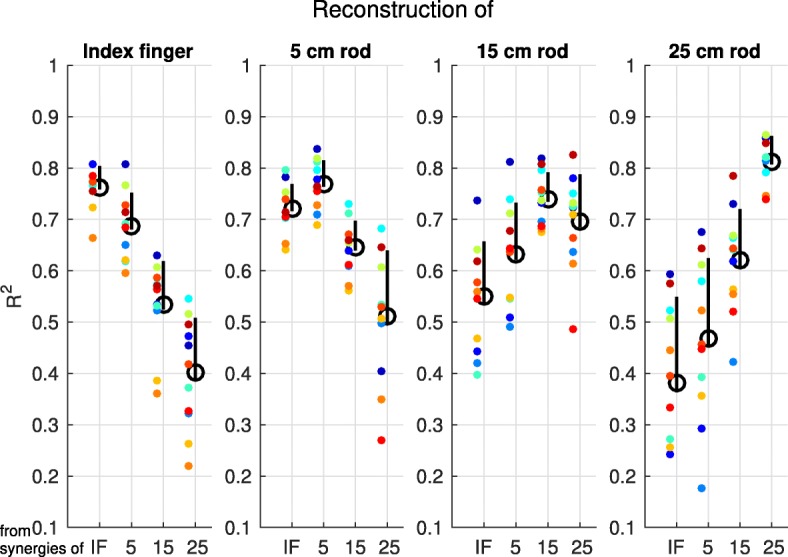
Fig. 10.

Explained variance of myosignals from the different end-effectors with the various total muscle synergy sets. Mean explained variance, indicated by the black circles, as averaged across participants, for the reconstruction of data from one end-effector using the set of muscle synergies extracted from the same or another end-effector. Upper vertical bars represent the standard deviation, lower vertical bars the standard error of the mean, and colored dots represent data of individual participants
