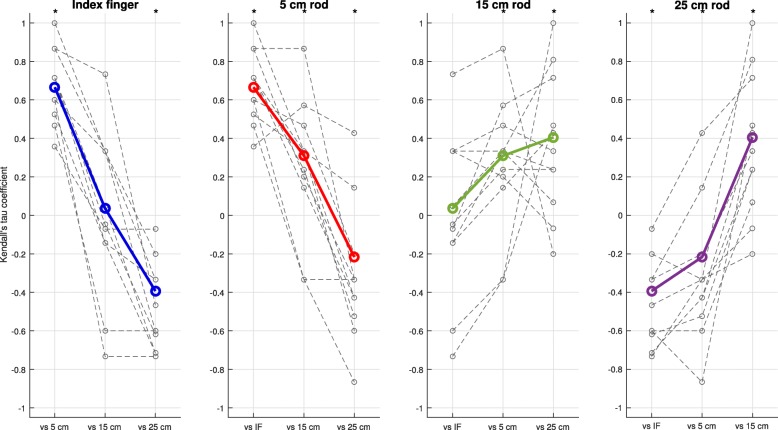
Fig. 12.
Kendall’s tau coefficients between the order of muscle synergy contribution of the different end-effectors. Every panel represents the coefficients for the comparison of orders of one end-effector with the orders of all other end-effectors. Colored solid lines represent coefficients including all participants, grey dashed lines represent coefficients per participant. Asterisks indicate coefficients including all participants significantly different from zero

