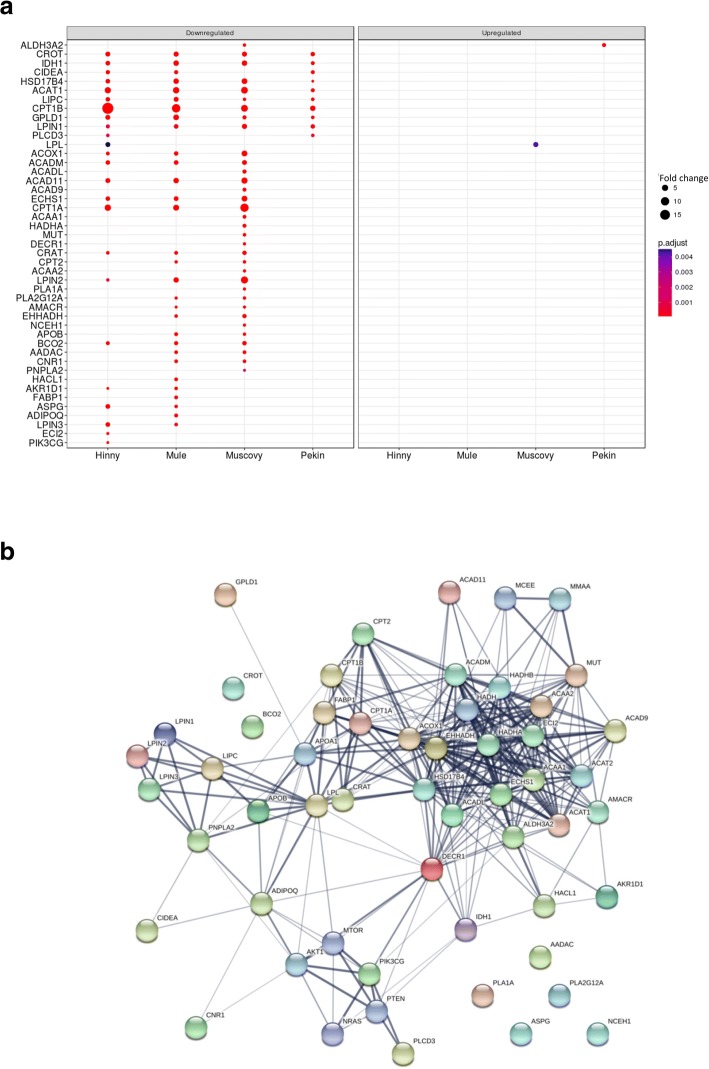
Fig. 8.
DEG involved in “lipid catabolic process”. Fold changes (FC > 2) in the four genetic types of the 45 down- (left panel) and up-regulated (right panel) significant (adjusted p value < 0.05) differentially expressed genes (DEG) annotated with lipid catabolism GO term (a). Interaction network of these 45 genes as defined by STRING (b). Minimum required interaction score was set to medium confidence (0.400). Lline thickness of the edges indicates the strength of data support (fusion, neighborhood, co-occurrence, experimental, text-mining, database and co-expression evidences)

