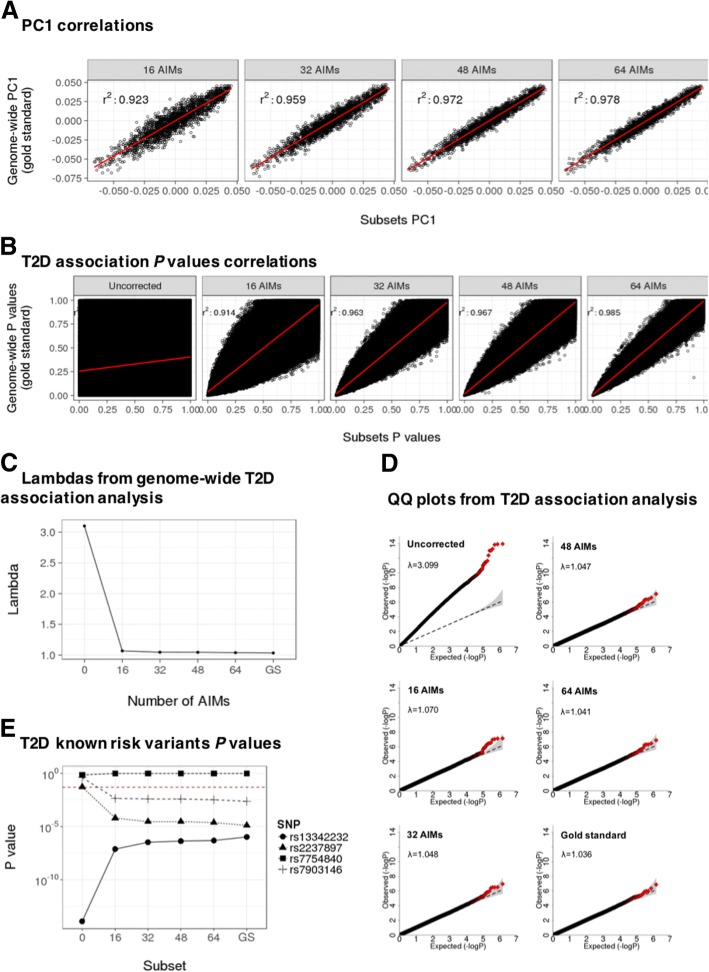
Fig. 3.
Selection of an accurate subset of AIMs. a. Correlation between gold standard PC1 and PC1 calculated using four nested subsets of AIMs. b. Correlation between gold standard T2D association P values and those obtained from T2D association analyses uncorrected for population stratification, as well as corrected for PC1 and PC2 calculated using four nested subsets of AIMs. c. Inflation factors (lambdas) calculated using gold standard T2D association P values, uncorrected P values for population stratification, as well as P values corrected for PC1 and PC2 calculated using four nested subsets of AIMs. d. QQ plots of P values from population stratification uncorrected and corrected T2D association analyses. e. P values obtained from previously well-known T2D risk variants when association analyses were uncorrected or corrected for population stratification using PC1 and PC2 calculated from either gold standard or four subsets of AIMs. GS: Gold Standard

