
Fig. 9.
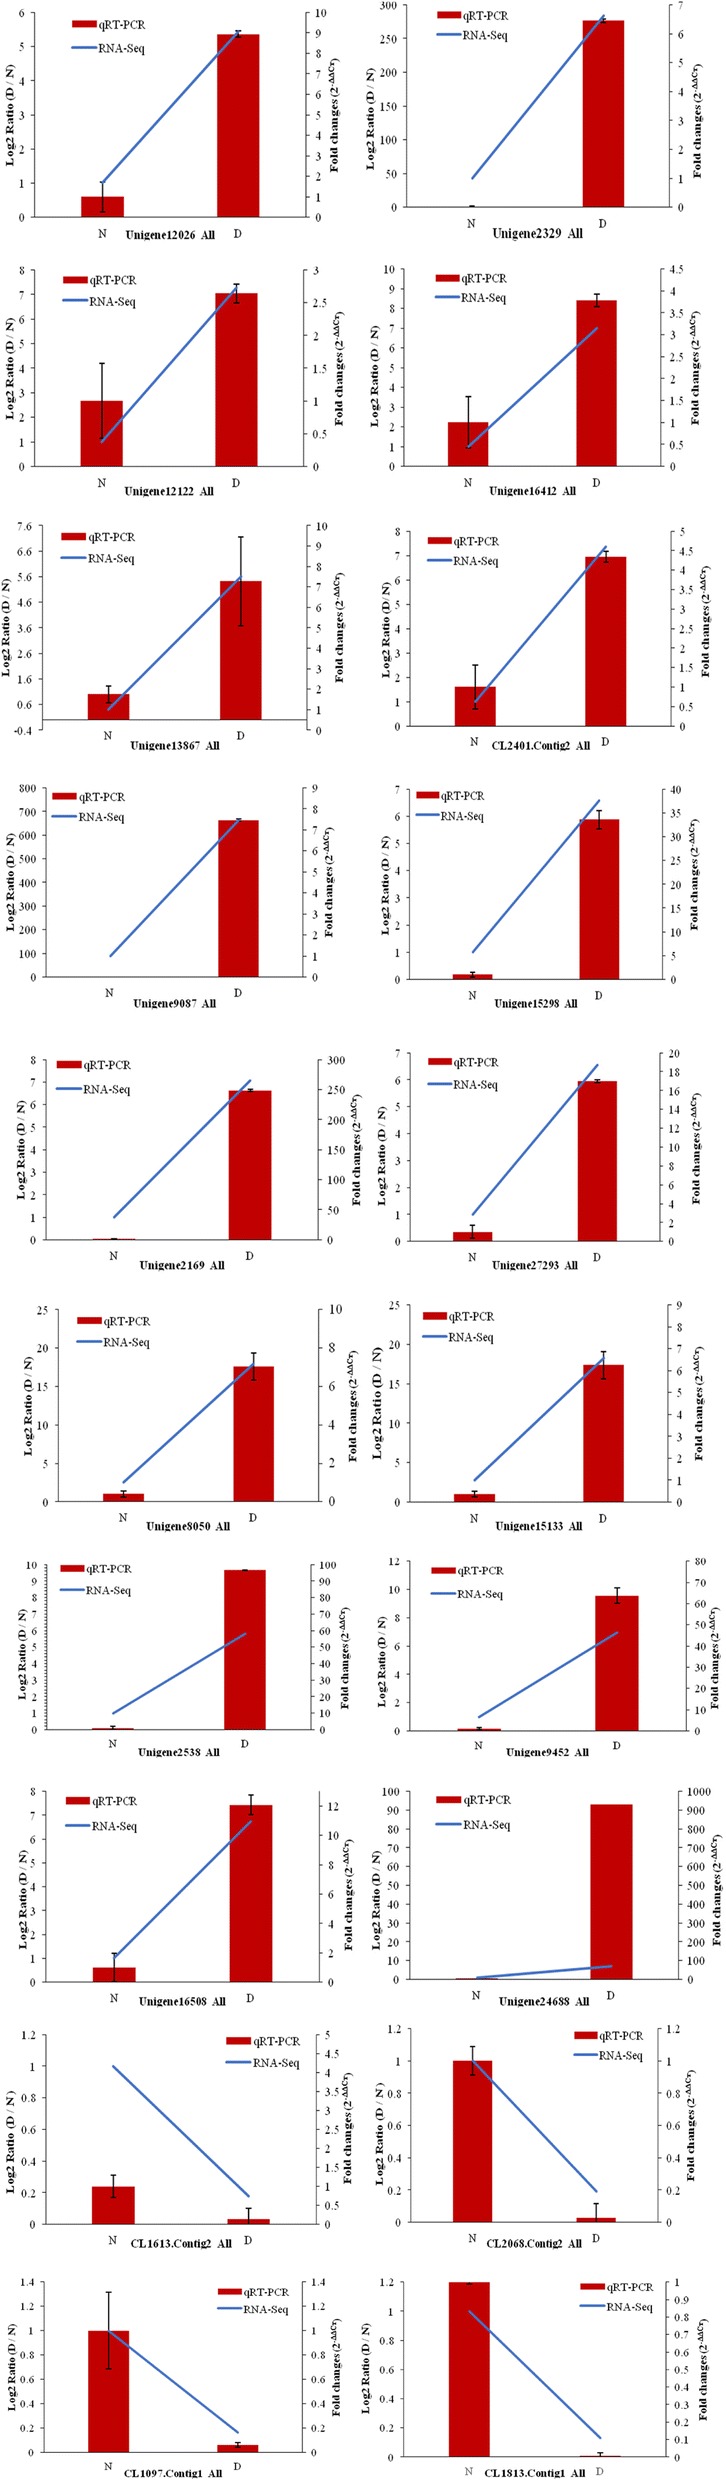
Validation of gene expression by quantitative real-time polymerase chain reaction (qRT-PCR). Gene expression levels were measured by qRT-PCR and compared with RNA-Seq results. Histograms represent the fold changes of genes (D3/N3) by qRT-PCR, whereas line charts represent gene expression according to the log2 ratio (fragments per kilobase of transcript per million mapped reads (FPKM) of D/FPKM of N) in RNA-Seq. All genes selected for qRT-PCR analysis were analyzed in three biological replicates. Bars represent the ± SEΔCт of three experiments. Details of the genes selected for qRT-PCR are provided in Table 3