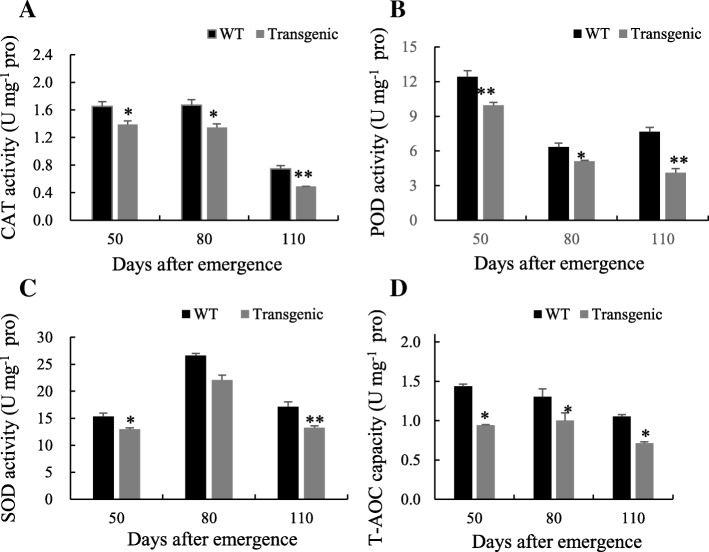
Fig. 6.
Activities of SOD, POD, CAT and T-AOC in transgenic and WT tobacco leaves. Tobacco leaf samples were taken at 50, 80 and110 days after emergence. Data are means ± SD calculated from six replicates. Symbols * and ** indicate significant difference between lines at 0.05 and 0.01 levels, respectively. a, CAT activity; b, POD activity; c, SOD activity; d, T-AOC capacity

