
Fig. 7.
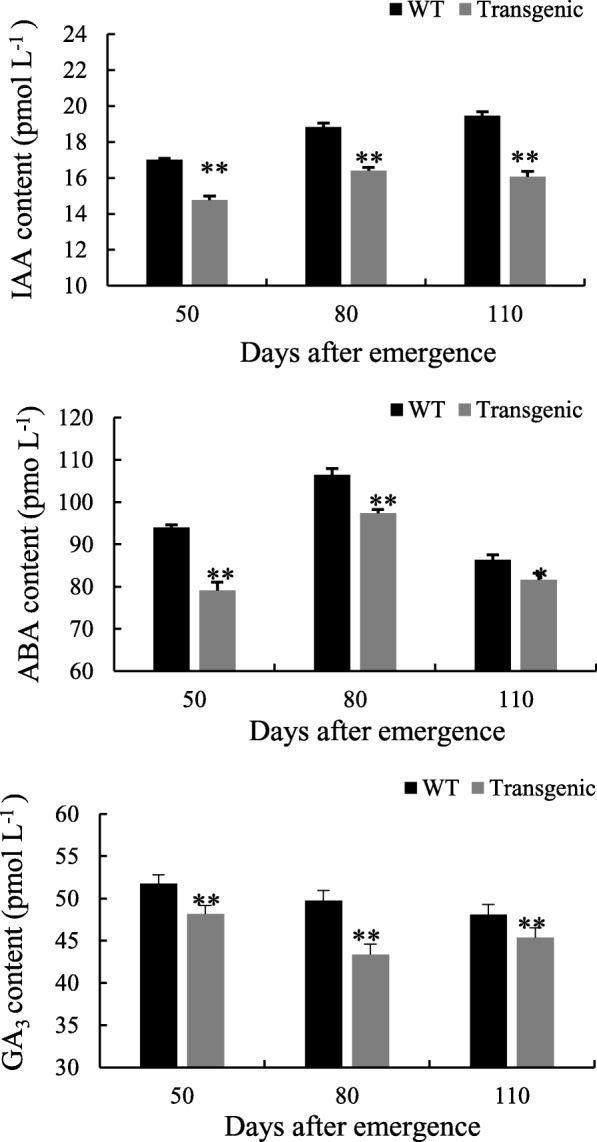
IAA, GA3 and ABA contents in leaves of transgenic and WT tobacco plants. The measurements were repeated for five times at each sampling date. Data are means ± SD calculated from three replicates. Symbols * and ** indicate significant difference between lines at 0.05 and 0.01 levels, respectively. Six separate experiments were performed, which produced similar results. a IAA content; b ABA content and; c GA3 content