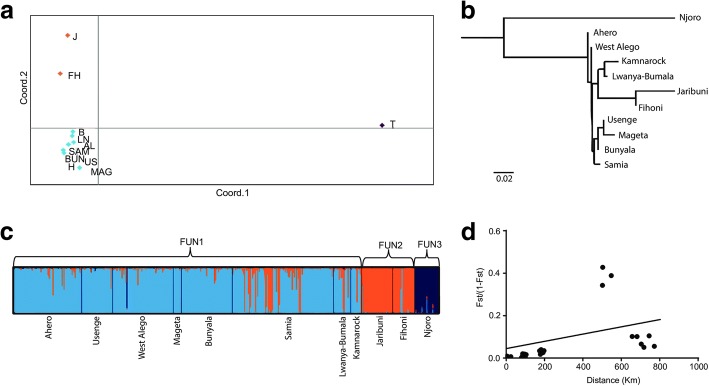
Fig. 2.
Population structure of Anopheles funestus in Kenya. a Principle coordinates analysis plot based on pairwise population FST estimates showing three clusters. b Neighbor-joining tree based on the FST pairwise estimates using 16 microsatellites. c Bayesian-based structure patterns K = 3 showing separation into 3 distinct clusters. d Isolation by distance comparing genetic distance versus geographical distance based on the Mantel test. The cluster FUN1 broadly include sites from western and Rift Valley, Kenya; coastal clusters FUN2 (Fihoni, Jribuni) and FUN3 (Njoro-Taita Taveta). Site abbreviations are indicated as in Table 1

