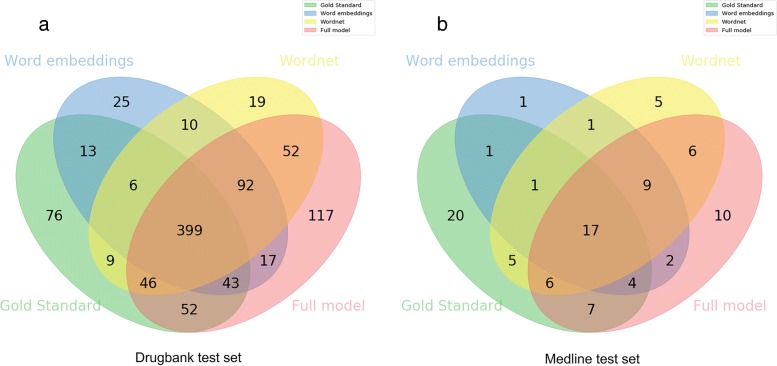
Fig. 5.
Venn diagram demonstrating the contribution of each configuration of the model to the DrugBank (a) and Medline (b) test set results. The intersection of each channel with the gold standard represents the number of true positives of that channel, while the remaining correspond to false negatives and false positives

