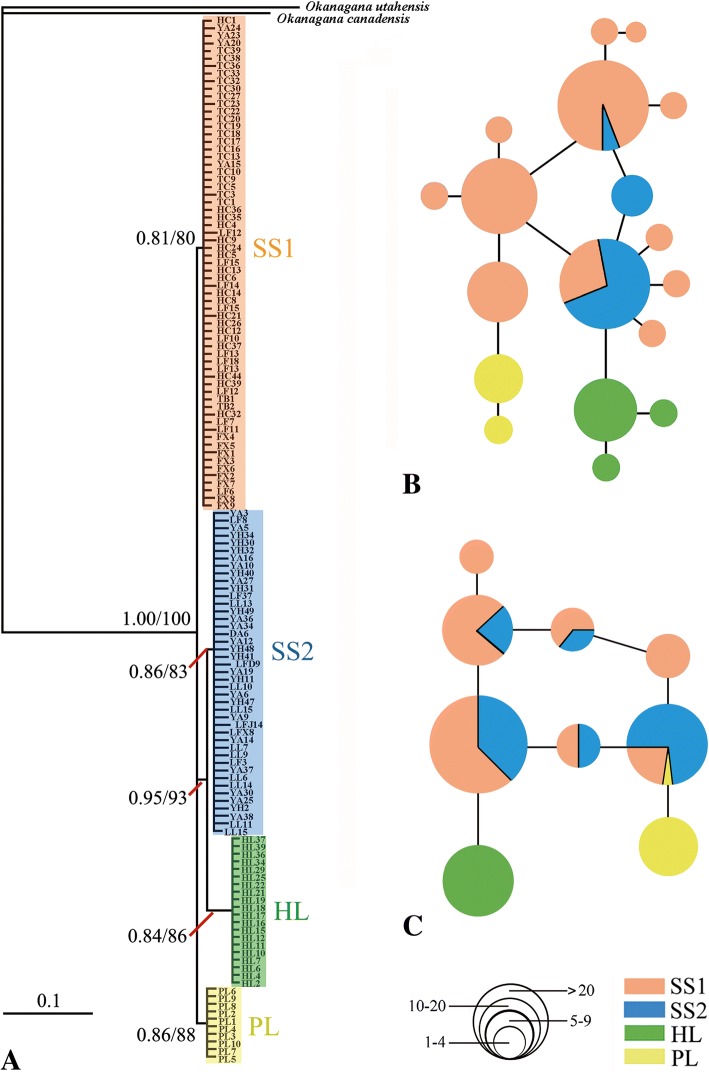
Fig. 2.
Phylogenetic tree and network profile. a phylogram reconstructed based combined mitochondrial (COI + COII + Cytb + A6A8) genes. Bayesian posterior probabilities/ ML bootstrap values are indicated near branches. b network of mitochondrial gene haplotypes of S. yangi. c network of nuclear gene haplotypes of S. yangi. The sizes of circles are proportional to haplotype frequency. Colours denote lineage membership and are the same as in a

