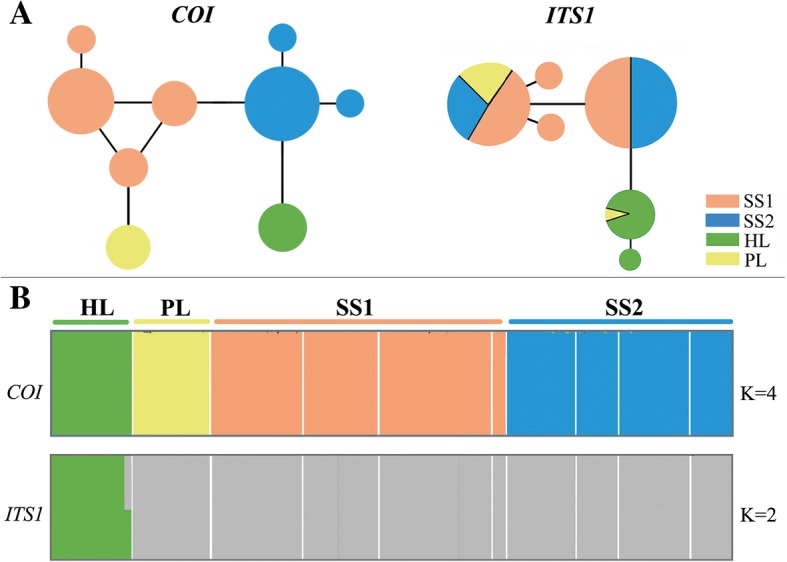
Fig. 3.

Population structure of S. yangi using the Network and Bayesian analysis of population structure (BAPS). a network of S. yangi based on COI and ITS1 gene haplotypes. b Bayesian analysis of population genetic structure (BAPS) based on COI (K = 4) and ITS1 (K = 2) sequences. Structure plots depicting population structure among samples from ten sites. Colours indicate different genetic clusters
