Fig. 4.

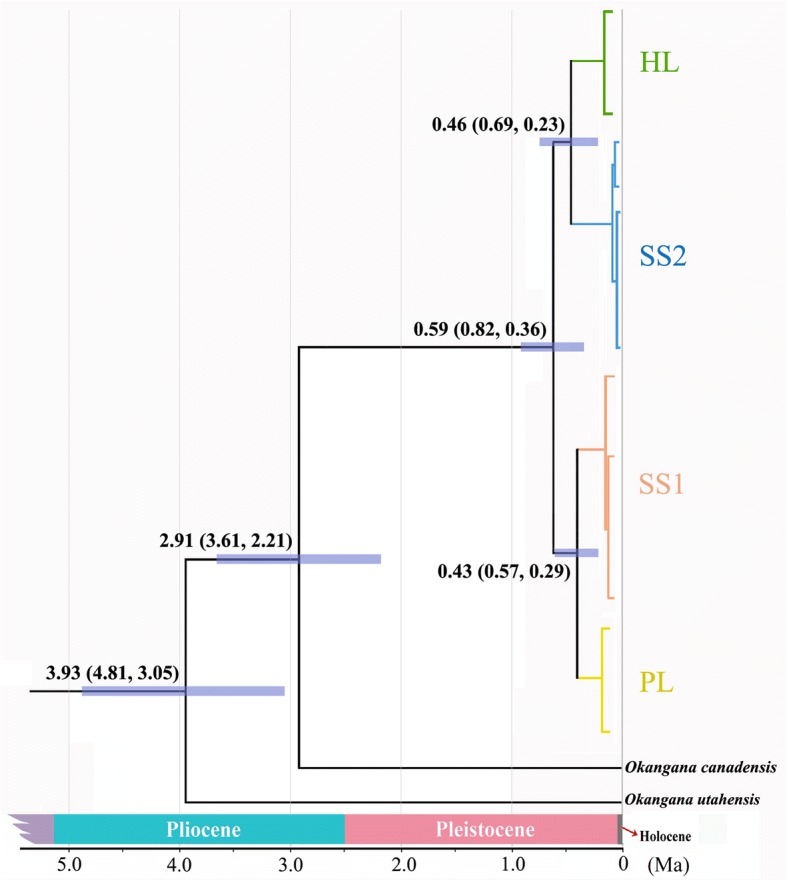
Chronogram of S. yangi based on mtDNA data, using the conventional divergence rate of 3.54% per million years. Estimates of divergence time are shown at nodes above branches. Divergence times at or below approximately 0.01 Ma are not shown

Chronogram of S. yangi based on mtDNA data, using the conventional divergence rate of 3.54% per million years. Estimates of divergence time are shown at nodes above branches. Divergence times at or below approximately 0.01 Ma are not shown