
Fig. 1.
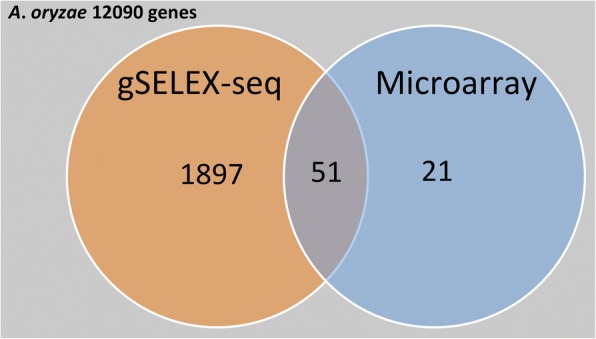
Venn diagram of the numbers of XlnR-related genes from gSELEX and microarray analyses. gSELEX-Seq: genes under the control of candidate AoXlnR-regulated promoters, obtained using gSELEX; Microarray: DEGs that showed more than five-fold higher expression in the AoXlnR overproducer than in the disruptant, which were identified using microarray analysis [22]. Values indicate the total number of genes in each set