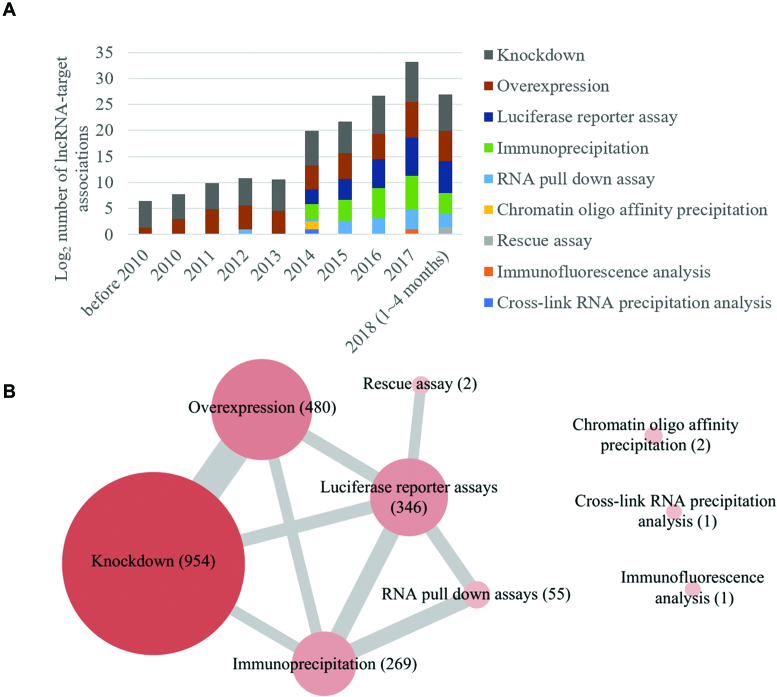
Figure 1.
Distribution of lncRNA–target associations identified by low-throughput methods in the LncRNA2Target v2.0. (A) The number distribution of lncRNA–target associations by year. (B) The number distribution of lncRNA–target associations by identified method. Each node represents one low-throughput method. Node size indicates the number of lncRNA–target associations identified by the method. Thickness of the edge represents the number of lncRNA–target associations that is validated by both of the linked methods.

