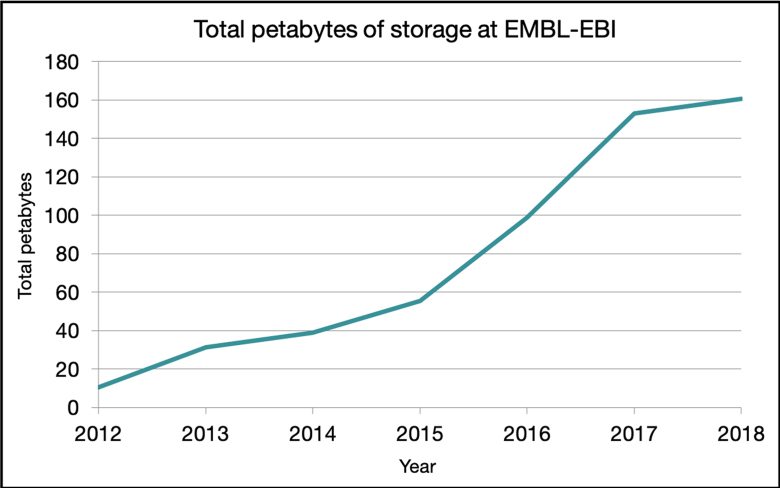
Figure 3.
Installed raw storage at EMBL-EBI. The chart shows total installed data storage at EMBL-EBI, including multiple backups for all data resources as well as unused space to handle submissions in the immediate future. The total volume of a single copy of all data resources is roughly 20–25% of the installed storage capacity. Data points (not shown) are the end of each calendar year, thus the range of the x-axis is 31 December 2012 through 31 December 2018. Data for end of 2018 are projected based on planned procurement. In 2017, we procured a high volume of disk space at good value that increased capacity substantially, requiring relatively less procurement in 2018. This approach allowed us to utilize our infrastructure budget efficiently.

