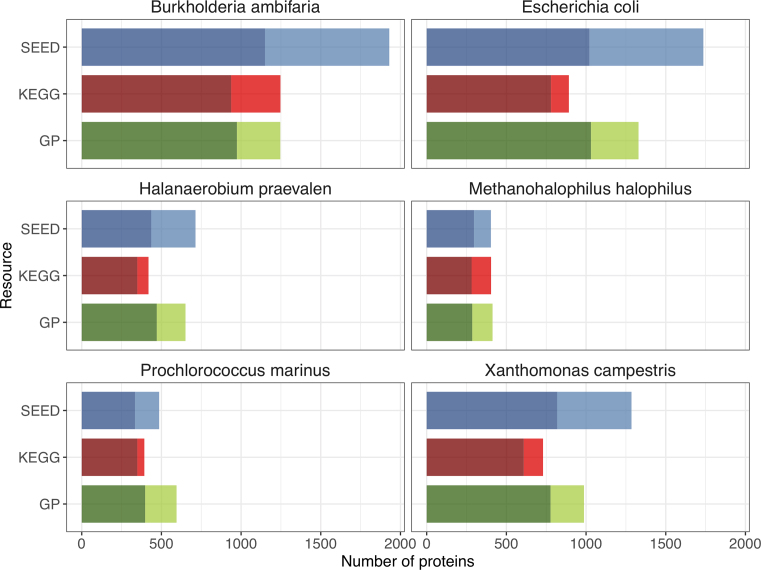
Figure 2.
Comparison of KEGG, SEED subsystems and Genome Properties coverage of six different proteomes. Columns are coloured according to the three different resources. Darker shading within the column represents the amount of overlapping coverage (where a sequence is annotated by more than one resource), lighter shading represents unique coverage (sequences uniquely annotated by the resource). Note, in this figure only the species names are shown; specific strain information is provided in Table 1. Total proteome size (total number of sequences) for each species is also detailed in Table 1.

