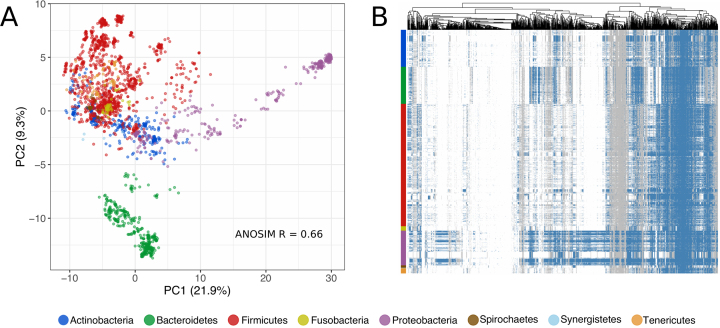
Figure 3.
(A) Distribution of Genome Properties (GPs) of 2468 human-isolated genomes by Principal Component Analysis, with each point representing a genome and coloured by phylum. An ANOSIM test was performed by phylum using the Gower distance measure. (B) Heatmap depicting presence (blue), partial (grey) and absence (white) of the GPs (columns) contained within the human-specific genomes (rows). The dendrogram represents the hierarchical clustering of the GPs based on the patterns across the genomes.

