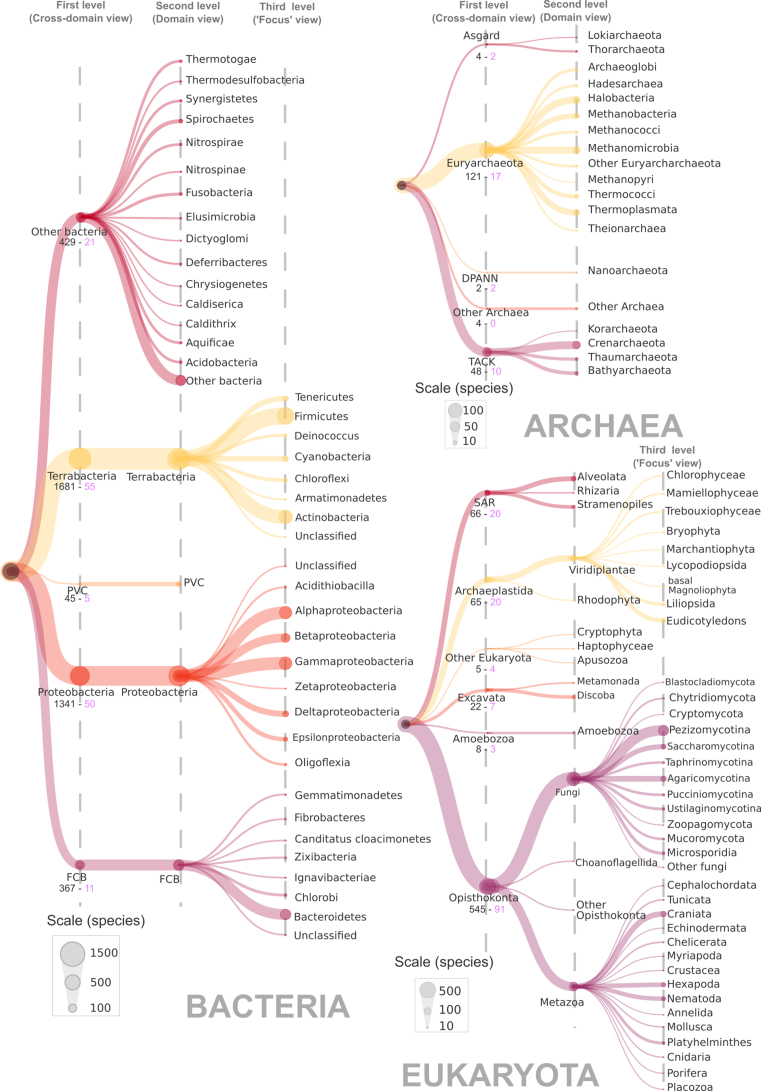
Figure 1.
Taxonomic distribution of species represented in OrthoInspector. The domain trees are distributed on three ‘levels’. The first level corresponds to the cross-domain taxonomic distribution heatmap shown when browsing the cross-domain database, the second level is shown on the heatmap for domain specific databases and the third level is the ‘focus view’ available for certain clades (see Figure 2). The size of a node is proportional to the number of species in the corresponding clades according to indicated scales. The number of species and model species in first-level clades are displayed in black and pink respectively.

