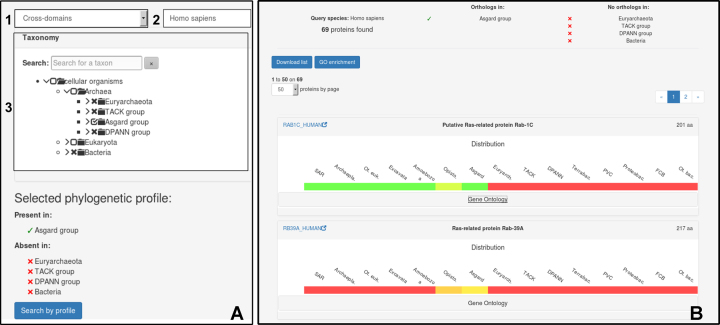
Figure 3.
Phylogenetic profile search interface. (A) Definition of the phylogenetic profile. User selects: (1) the database, (2) the query species in the drop-down menu and (3) the presence/absence constraints using the phylogenetic tree. A summary of constraints is shown below the tree. Here, human proteins absent in Prokaryotes except the archaeal Asgard group are selected. (B) Output of the profile search. Constraints are included on the top with the number of proteins found. Proteins are displayed in panels, showing their distributions and functional information. Gene Ontology enrichment can be performed on the protein list.

