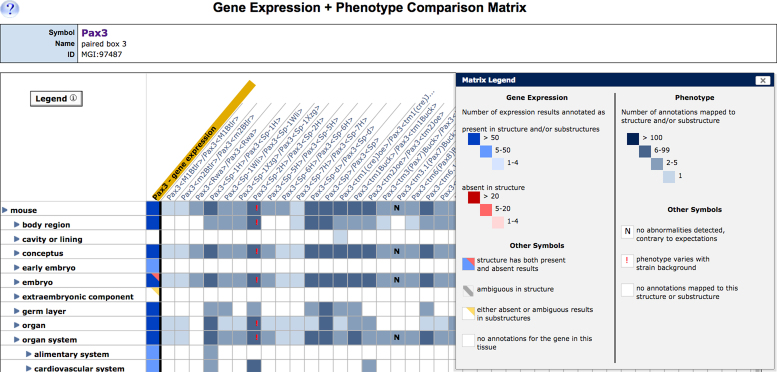
Figure 2.
Screenshot of the Gene Expression-Phenotype Matrix. The first column (gold highlight) summarizes the wild-type expression pattern of the Pax3 gene. The color of matrix cells in the column indicates the type and number of expression annotations for each tissue; the conventions are defined in the matrix legend (inset). Genotype summary data associated with alleles of Pax3 are displayed in the adjacent columns. The tissues where each mutation/genotype has phenotypic effects are indicated by the presence of colored matrix cells. Cells with an ‘N’ indicate that an expected abnormality was not detected. A red exclamation point indicates the phenotype is affected by changes in mouse strain background. Clicking on blue toggles next to term names expands and collapses the anatomy vocabulary tree. Annotation details are displayed when users click in the cells of the matrix.

