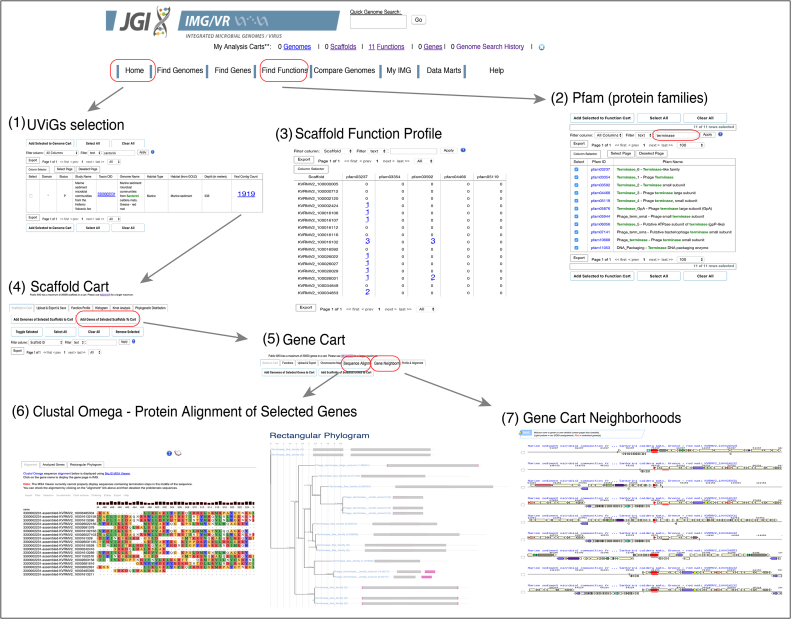
Figure 3.
Example of analyses features in IMG/VR v.2.0. (1) UViGs were selected from a ‘Viral Datasets’ sample and added to the ‘Scaffold Cart’. (2) From the ‘Find Functions’ tab protein families (pfams) were filtered by the text ‘terminase’ obtaining pfams associated with this predicted viral function. (3) Located in the ‘Scaffold Cart’, the ‘Scaffold Function Profile’ option allows user to see the distribution of the selected functions (pfams in this example) against the selected list of UViGs. (4) Additionally, all genes from the selected UViGs can be added to the ‘Gene Cart’ by clicking ‘Add Genes from Selected Scaffolds to Cart’. (5) ‘Gene Cart’ functionality allows users to perform (6) gene or protein alignments of selected sequences and visualization as a phylogram or (7) to display the gene neighborhood of the selected genes (underscored in red). The location of the tools or the steps necessary to recreate this example are indicated in a red box.

